
At Uber, we use marketplace algorithms to connect drivers and riders. Before the algorithms roll out globally, Uber fully tests and evaluates them to create an optimal user experience that maps to our core marketplace principles.
To make product testing safer and easier, the Uber Marketplace Simulation team built a simulation platform that hosts a simulated world with driver-partners and riders, mimicking scenarios in the real world. Leveraging an agent-based discrete event simulator, the platform allows Uber Marketplace engineers and data scientists to rapidly prototype and test new features and hypotheses in a risk-free environment.
The simulator leverages historical data to run simulations with two important components: Marketplace services and user behavior models. Marketplace services leverage these insights to make dispatch decisions. The user behavior model uses simulation context to determine riders’ and drivers’ decisions, such as trip cancellations and navigation choices.
To make model deployment and training easier and more accurate, Uber’s Marketplace Simulation team built a machine learning (ML) framework that can seamlessly build, train, and serve the models on the simulation platform. Since it improves simulation accuracy and realism, ML plays an important role in predicting user behavior on our simulation platform. In fact, most simulated user behavior on our platform is model-based and trained with anonymized, aggregated historical data. Simulation also helps develop and improve ML models. New models can onboard to our simulation platform and iterate quickly before rolling out to production services.
Our team designed an ML model training framework to enable users to quickly build and deploy models on our simulation platform, while simultaneously improving our ML models through simulation.
Simulation platform machine learning framework
ML lies at the heart of a growing number of important features in the simulation platform. Before we introduced the ML framework to the simulation platform, ML development, training, and serving had consisted mainly of ad-hoc, non-reusable solutions. For example, ML developers implemented ML models directly in a simulator and trained the model on the fly when the simulator was running.
These one-off solutions quickly accumulated complexity within the simulator as developers implemented multiple models and added model versioning. The simulator became difficult to maintain and these different models took large amounts of RAM and CPU resources for training, which led simulator performance to degrade. In these types of scenarios, having custom top-to-bottom training and serving code for each model becomes untenable.
The Simulation team set out to build a single, efficient, and reusable framework for most ML training and workload serving on our simulation platform. Our framework offers a mix of open source systems and components built in-house. It operates on four layers:
- A Python ML library consisting of APIs and modules from which to construct an ML model on the simulation platform
- An automatic training pipeline to train models and save them into a binary
- A back-end service that manages all models’ metadata
- A centralized module in the simulator that loads selected models into the simulation
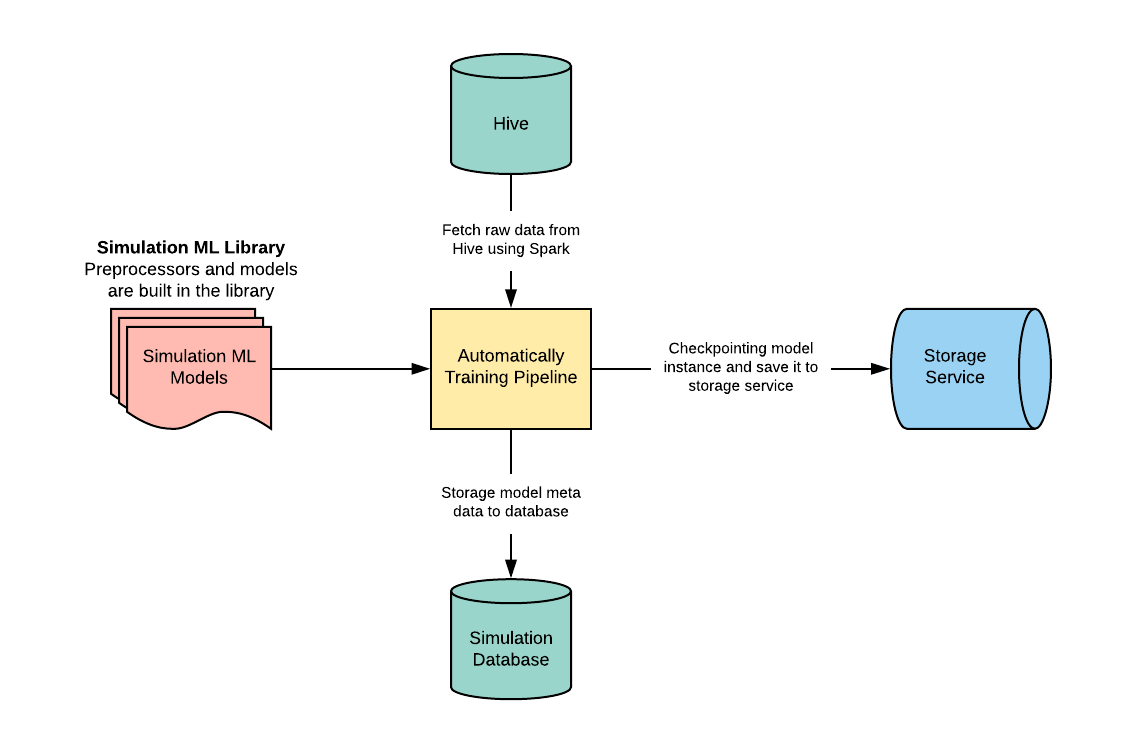
In our simulation ML framework training workflow, the training pipeline imports a Python ML library, fetches and processes raw data from Apache Hive using Apache Spark, and trains the models automatically based on historical time series data. Once the pipeline finishes training with this data, it sends its metadata to the simulation database and checkpoint model instance, then saves the binary file in Uber’s storage service.
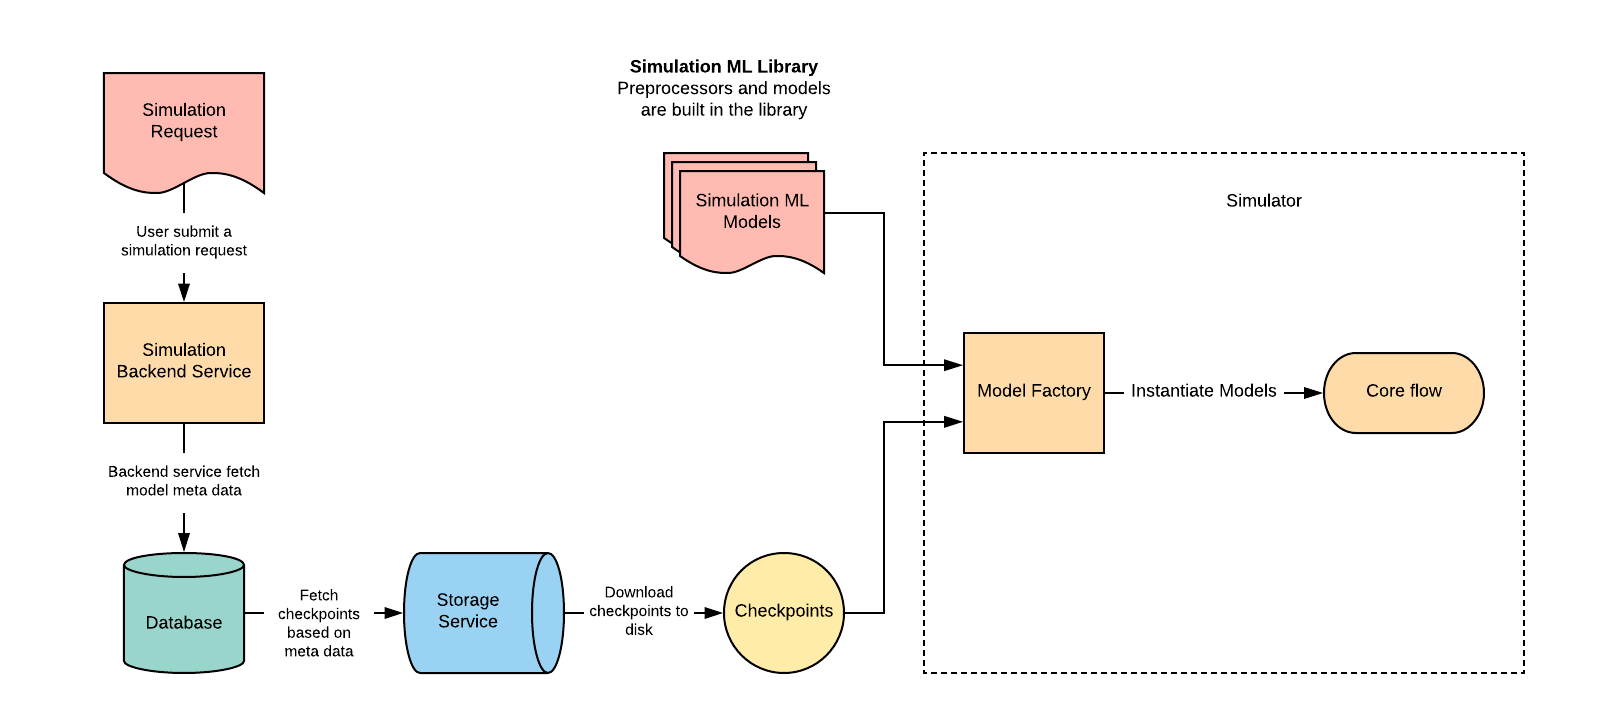
In our model-serving workflow, when our simulation back-end service receives requests to create simulations, it fetches related ML models’ metadata based on user settings in the requests and uses metadata to download model checkpoints to a local disk. After that, the simulation back-end service starts running simulators, which has a model factory. The model factory then imports its Python ML library and scans the checkpoint in the local disk, where it instantiates the related models and outputs the instances to the simulation core flow.
Figures 1 and 2 below show the machine learning framework’s training and serving workflow:
In this framework, we largely decoupled our training and serving workflows. This change provides the flexibility model developers need to constantly evolve their models. With this system, if developers want to change the user behavior models, all they have to do is update the implementations in the Python ML library. The framework will then automatically trigger the training pipeline and populate the latest model to all simulators.
By removing model training workloads from the simulator, we’ve simplified the complexity of the simulator to significantly improve its RAM and CPU usage. This change also increases the simulator’s throughput. Combined, these simplifications conserve hardware resources and improve system efficiency.
The Marketplace Simulation team has used this framework to integrate several user behavior and other ML models onto the simulation platform in a standardized way.
How supply movement models improve marketplace simulation
As suggested by recent research on ride-sharing simulations, driver movement is a major factor in simulation accuracy and realism. On Uber’s Marketplace Simulation Platform, experimental Marketplace algorithms led to counterfactual matches, causing driver movement to be different than that reflected in real-world historical data. For example, a driver in the simulation may match with a different rider than they did in reality. In this case, the simulator could not simply reuse the historical driver movements to simulate the route, the length of the ride, and the drop-off location. In order to remedy this problem, we knew we needed to build a model that accurately simulated driver movement behaviors. With a proper movement model, we could enhance rider behavior models (e.g., the rider cancellation model) and reduce the noise in matching and pricing algorithms, which we do to ensure that our marketplace principles are upheld.
Accurately simulating each driver’s movement is a very challenging task because the simulated world runs on limited historical data and lacks many factors that can influence user behavior, such as traffic information, weather, and geographical data.
Fortunately, for most Marketplace algorithms, a single driver’s movement does not significantly impact the algorithm results. These algorithms leverage aggregated distributions of drivers rather than individual drivers’ motions, particularly for rider-driver matching and pricing algorithms. For this reason, rather than trying to perfectly simulate each and every driver’s movements, we built a model to simulate driver distributions accurately.
To achieve our objective in a simulated world, we divided online driver movement behavior into two states: on-trip and off-trip. We created a hybrid model based on different driver behaviors in these two states, as shown in Figure 3, below, to better forecast user demand in Uber’s marketplace:
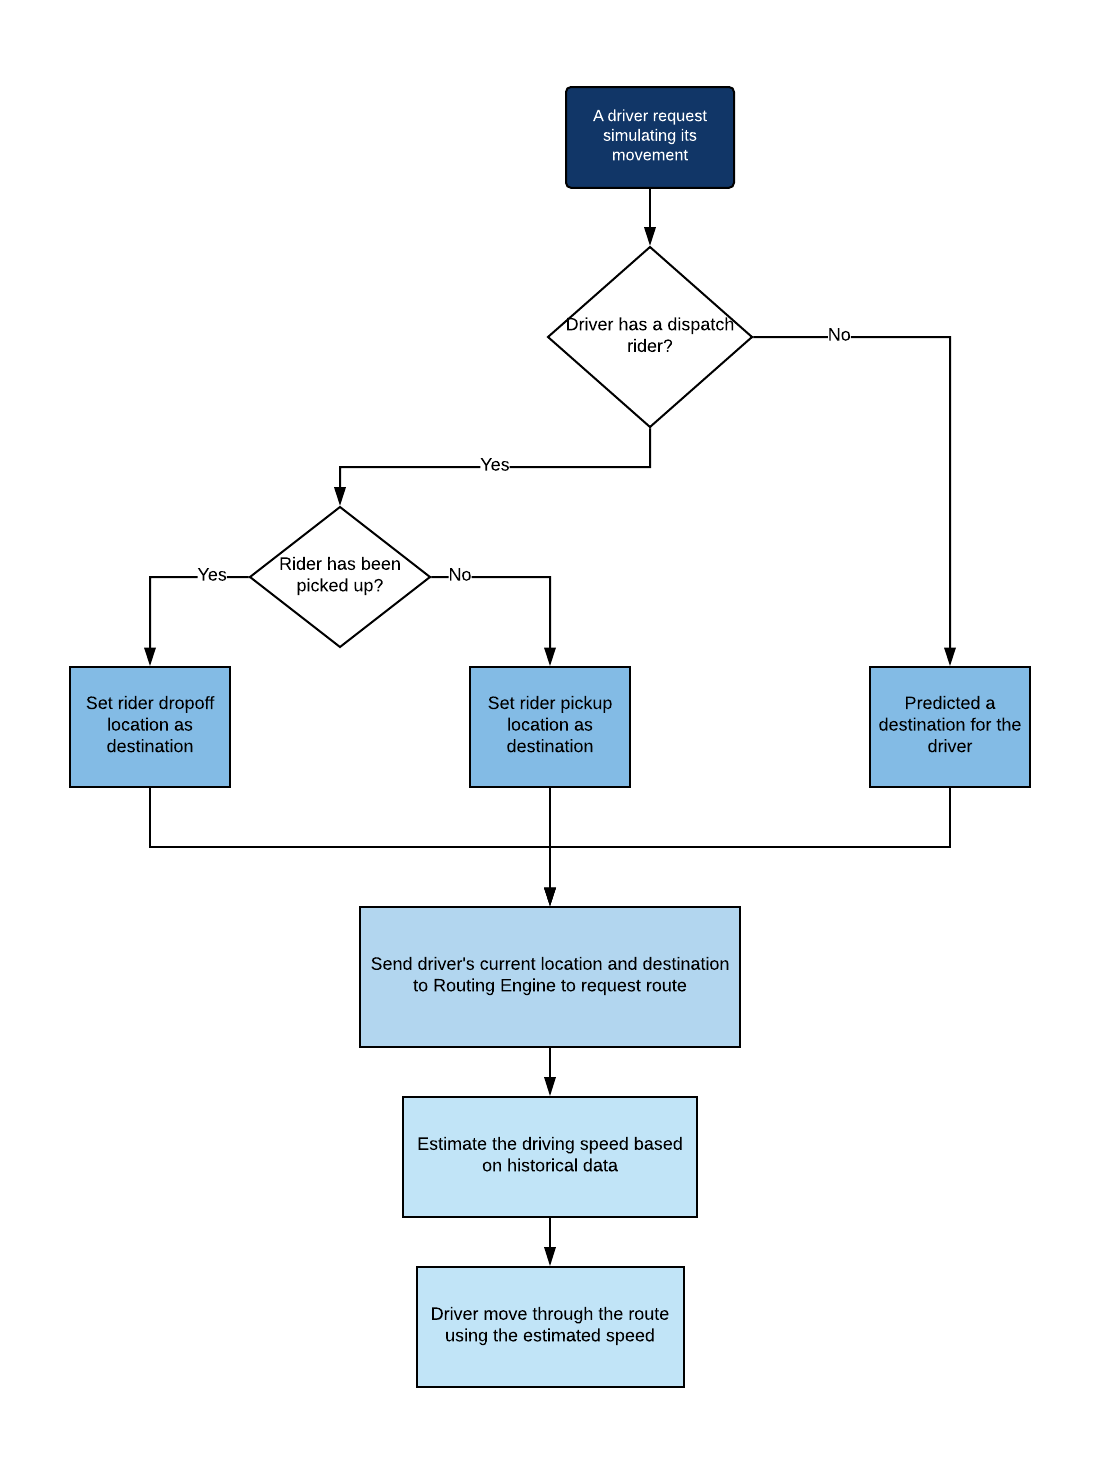
We applied a rule-based model for on-trip drivers. When a simulated driver accepts a trip, the model uses a routing engine to direct drivers along their routes to a predetermined destination.
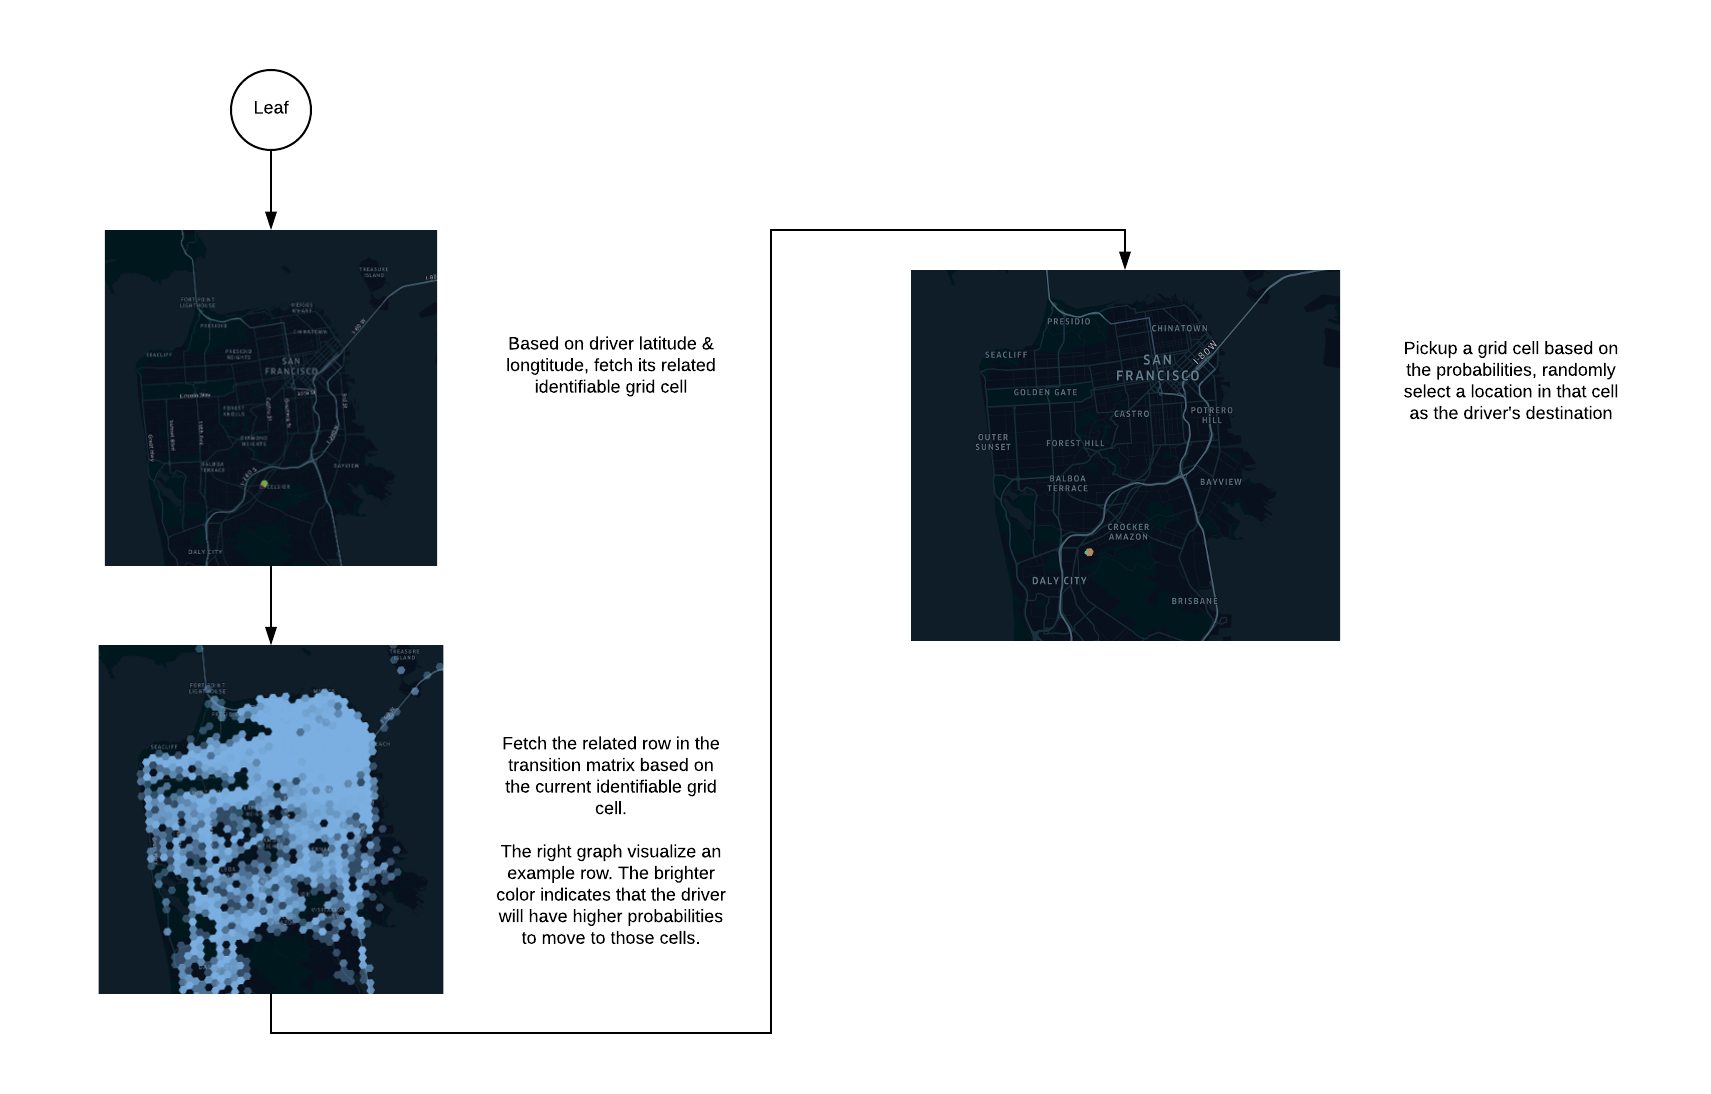
Simulating off-trip driver distribution is much more difficult. As previously mentioned, the simulated world often does not accurately reproduce historical driver movement. For this reason, we use an ML model alongside historical data to predict aggregated off-trip driver movement. Using production-grade algorithms, this model simulates the open drivers’ distribution as close to historical distribution as possible. We trained a tree-based stochastic model to accomplish our goal of simulating off-trip driver distribution accurately. Figures 4, 5, and 6, below, provide examples of how this model works:
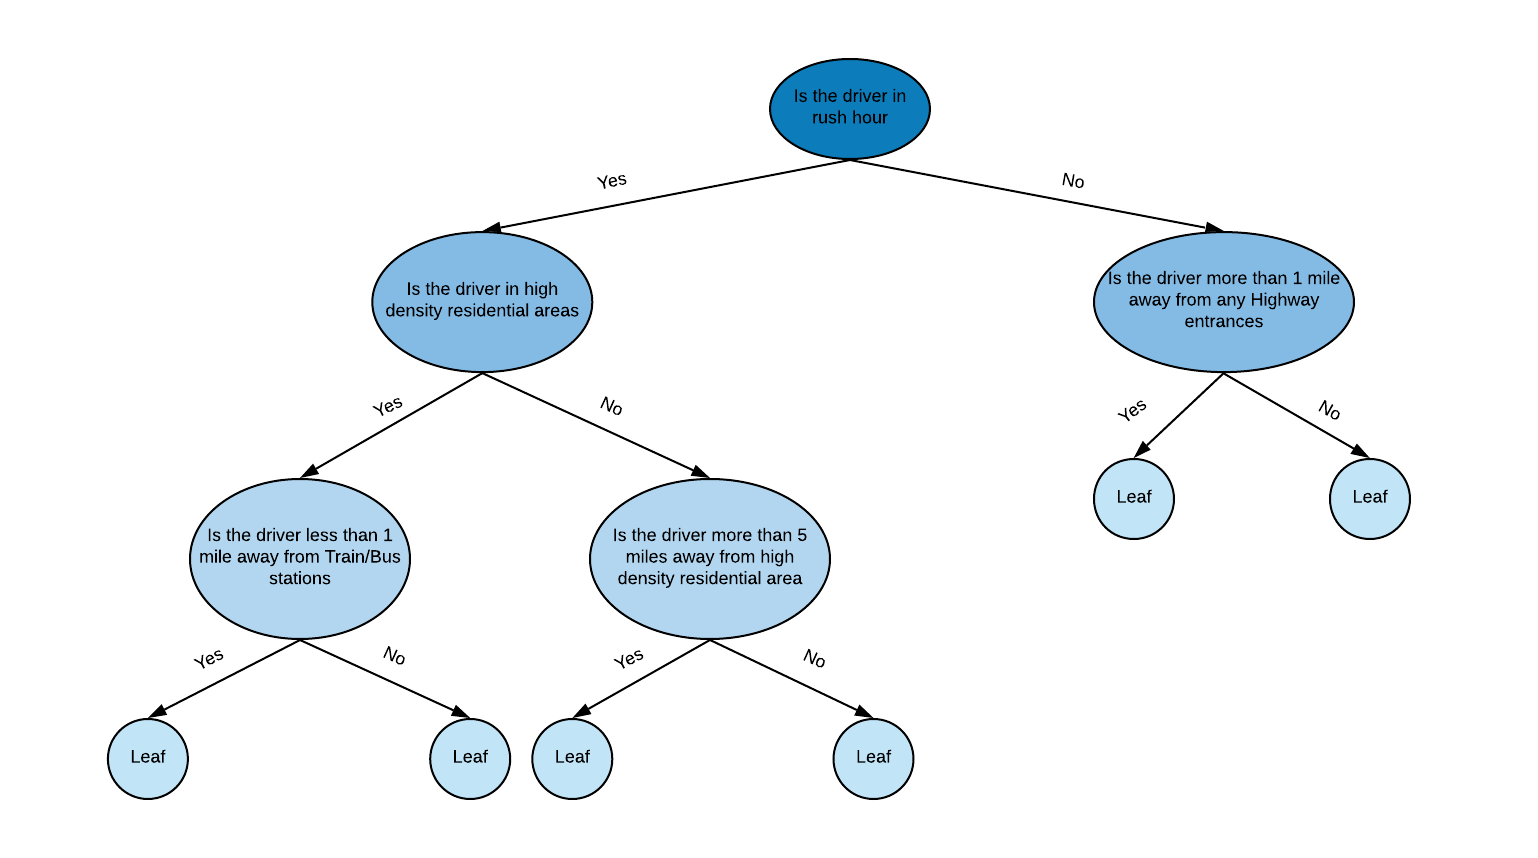
When the simulation wants to predict an off-trip driver’s destination, it fetches the related leaf node from the tree model using the open driver’s information (e.g. location, timestamp, etc.), as shown in Figure 4. The leaf node contains a transition matrix that predicts the simulated driver’s future movements. In our simulation platform, we partition areas of the earth into identifiable grid cells using H3, our open source hexagonal, hierarchical spatial index. By using these identifiable grid cells, we defined our transition matrix as in Figure 5, below:
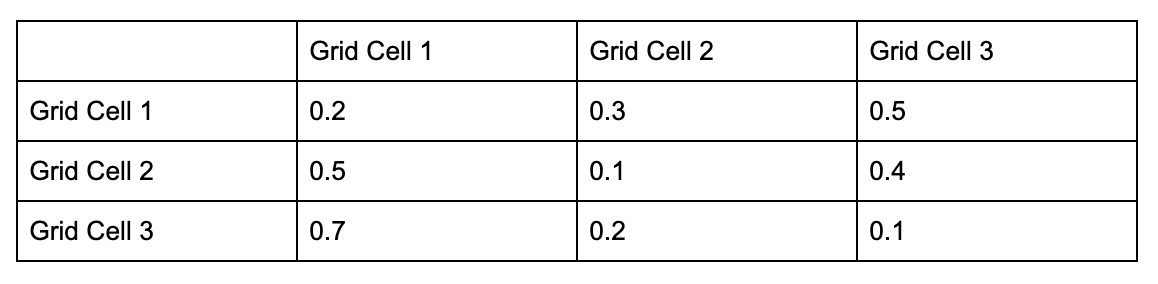
The values in the transition matrix describe the probability that a driver will move to Grid Cell Y given that the driver is currently in Grid Cell X.
By using this type of transition matrix, the simulation can predict which cell the open driver is likely to move to next. After that, the simulation randomly selects a location inside that cell and assigns it as the destination of the open driver. Figure 6, below, demonstrates this process:
Once the simulator predicts an open driver’s destination, it estimates the driver’s route and speed, then moves the driver to the destination. One key difference between on-trip and off-trip drivers is that open drivers might change their status (go offline/be dispatched) while driving to their destinations.
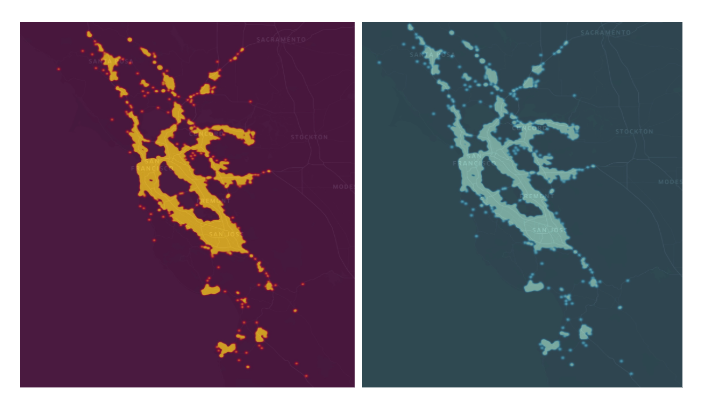
Using the hybrid driver movement model, our Marketplace Simulation Platform gains an accurate approximation of driver distribution in the real world. We have compared the distributions with real-world distributions using the same algorithms. Figure 7, below, shows the peak hour driver distribution comparison:
How simulation helps us experiment with matching algorithms
Uber’s platform connects riders and drivers in real-time by using matching algorithms that optimize for various factors, including ETA, routing, user locations, trip preferences, and price.
Based on recent research, ride-sharing programs often use large-scale combination algorithms to optimize user matching. However, as ride-sharing needs diversify, these algorithms must take more and more factors into account. To accommodate the increasing complexity of matching, our team integrated machine learning (ML) models into the optimization algorithms to increase simulation throughputs. We used a combination of a recommendation system and maximum bipartite matching. We’ve depicted our entire workflow in Figure 8, below:
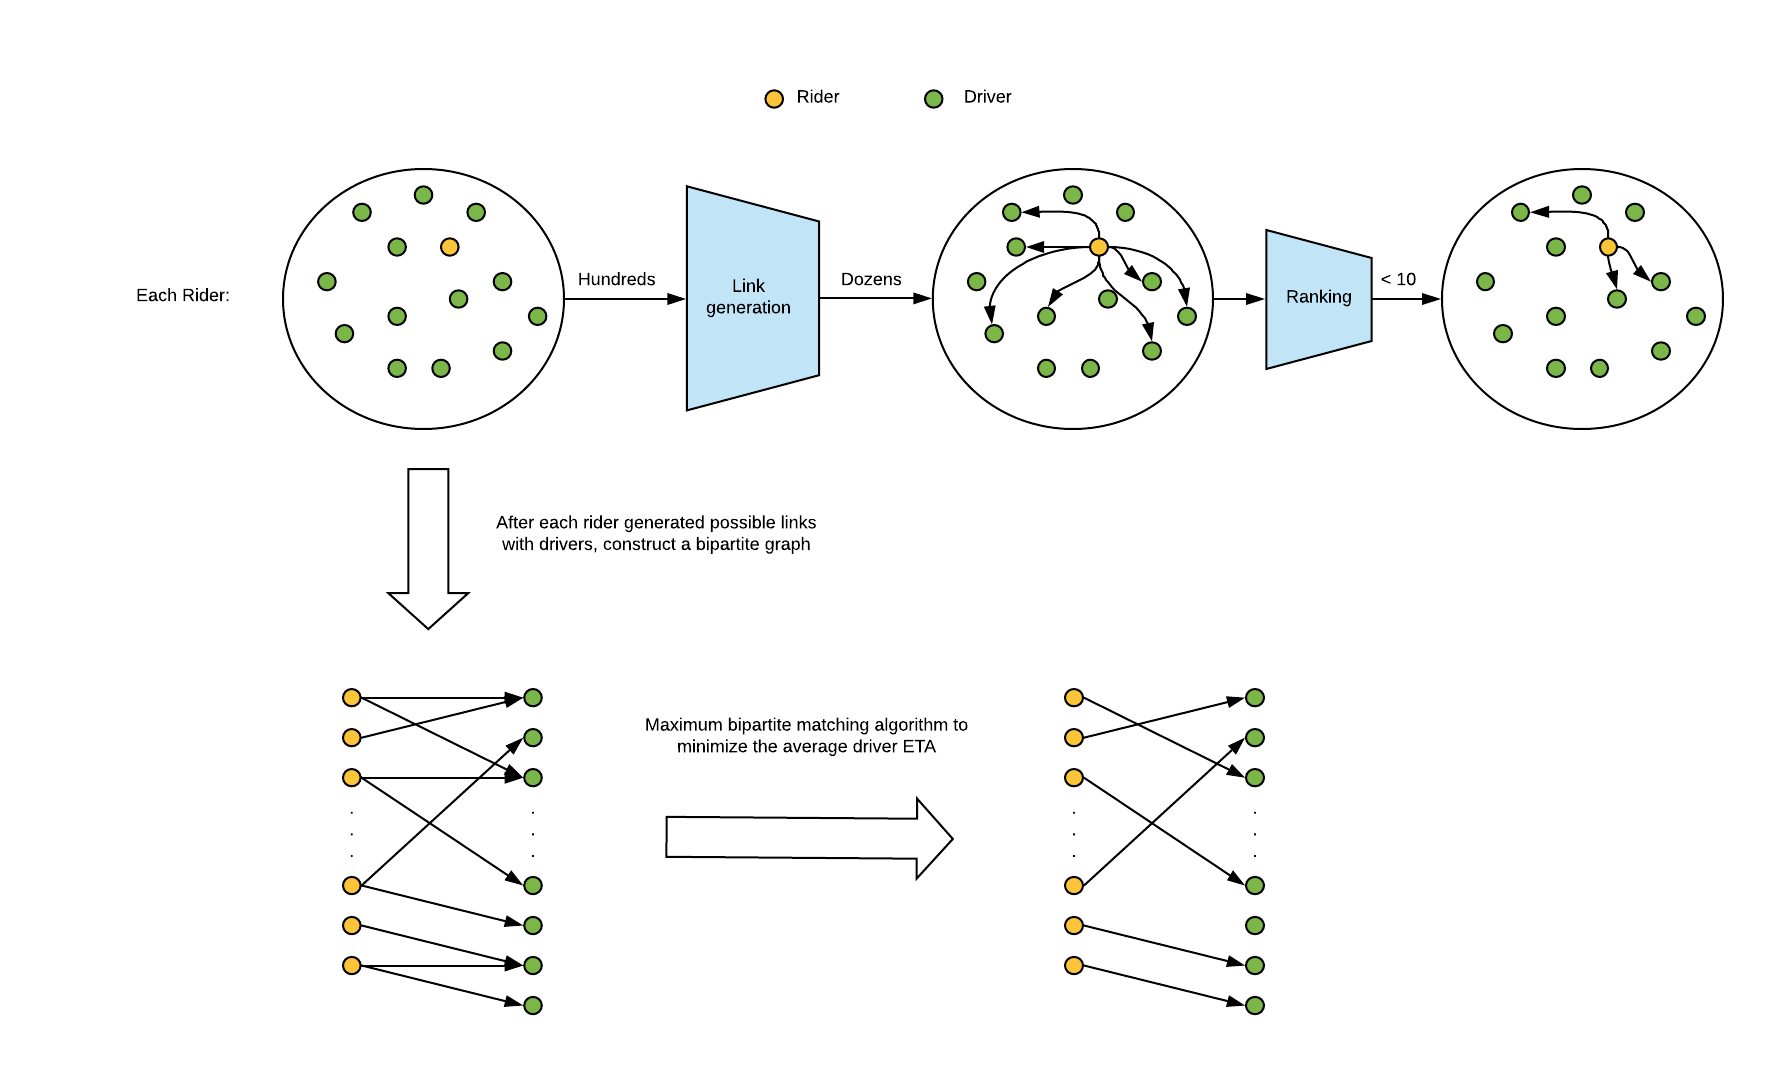
In our matching solution, the recommendation system suggests a few drivers per rider with scores for each pair. Based on the recommendation results, we construct a bipartite graph with weighted edges, which matches one driver with a single rider. We used the maximum bipartite matching algorithm to solve this problem efficiently.
It was a challenge to develop the recommendation system based only on rider and driver locations. Without other context, building a recommendation system using traditional collaborative filtering, factorization machines, or deep neural networks is impossible due to lack of features. In order to solve this problem, we looked to large-scale social network recommendations, which have encountered the same challenges and devised effective solutions for them (as covered by Future Generation Computer Systems, Cornell University, and the International Workshop on Languages and Compilers for Parallel Computing).
After conducting comprehensive research, we decided to design our recommendation system using one of the solutions social networks have implemented: graph representation learning and link prediction models. As depicted in Figure 8, we constructed a graph that depicts vertices as riders and drivers based on rider and driver locations. We created the edges of the graph based on the routes between riders and drivers using some rule constraints, such as driver ETA and distance between the rider and the driver. After the simulator constructs the graph, we can predict the score for each edge based on historical dispatch results.
However, the information for each node and edge is very limited in the constructed graph, since it only contains the locations and routes. Inspired by graph representation learning methods such as GraphSAGE, we aggregated information from neighbors to extract enough features for each node, as shown in Figure 9, below:
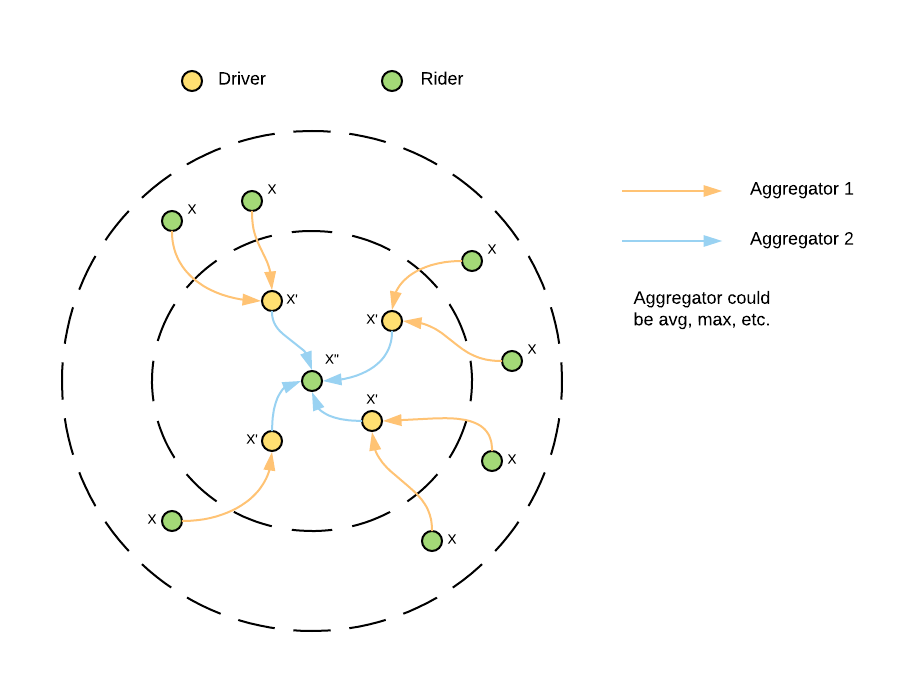
These features reflect the nearby network structure information for each node. In addition, we normalized some continuous features and embedded them to the feature vector to make our model more generic, emulating recent research.
The model we eventually settled on to predict the scores for each pair is a Gradient Boosting Tree with dropouts. Since a significant portion of the training data results in negative pairs (in which the driver and rider were not matched), we downsample the negative pairs and upsample the positive pairs (in which the driver and rider were matched) before we train the model.
After training the model, we use it to predict top-k potential drivers for each rider based on its pairs’ scores. In this case, according to the predicted results, each rider would be linked to multiple drivers, and a driver could also be linked with multiple riders. We then construct a bipartite graph based on links and apply a maximum bipartite matching algorithm to solve the bipartite matching problem and achieve minimum average driver ETA.
Moving forward
By progressively integrating ML models into the simulation platform using our ML framework, we can test more user behaviors and experimental marketplace algorithms and features in simulation. This system helps Uber accelerate its development process and deliver safe, reliable transportation products.
In the future, we intend to enhance the simulation ML framework with the following features:
- Hyperparameter automatic tuning. ML models contain many hyperparameters, such as learning rate and tree depth. Tuning these hyperparameters is time-consuming and error-prone. We plan to integrate hyperparameter tuning tools into our model training pipeline to amplify model developer productivity and make engineers’ jobs easier.
- Online model performance monitoring. Most of the ML models on the simulation platform are directly affected by environmental factors like time and location. Over time, model performance degrades because the environment (e.g., traffic patterns) in the simulations changes. To keep our models accurate throughout these shifts, our models need to be re-trained with new data. An online model performance monitoring system could monitor the model serving performance and trigger the training pipeline once the performance is lower than a certain threshold.
- Distributed machine learning serving. Uber’s engineers are integrating an increasing number of ML models into the simulation platform. As such, our current framework has encountered computing resource starvation, which causes latency for predictions to increase significantly. Therefore, the simulation throughput becomes worse. A high performance distributed ML serving component could help solve this issue.
- Configurable machine learning model development. Most ML models in Simulation Platform share common components, such as data processing logic and underlying machine learning algorithms. To simplify the model development process for most users, we plan to build a configuration driven model development framework. It could construct behavior models based on simulation users’ input configurations.
These are just a few of our plans for further improving the simulation ML platform and ensuring it runs smoothly.
If you are interested in shaping the future of transportation with us, consider applying for a role at Uber!
Adam Hotz and Qianyi Wang also contributed to this article.

Haoyang Chen
Haoyang Chen is an engineer on Uber’s Marketplace Simulation team.

Wei Wang
Wei Wang is a senior engineer on Uber’s Marketplace Simulation team.
Related articles


Most popular

Network IDS Ruleset Management with Aristotle v2

Load Balancing: Handling Heterogeneous Hardware

Using Uber: your guide to the Pace RAP Program
Balancing HDFS DataNodes in the Uber DataLake
Products
Company
