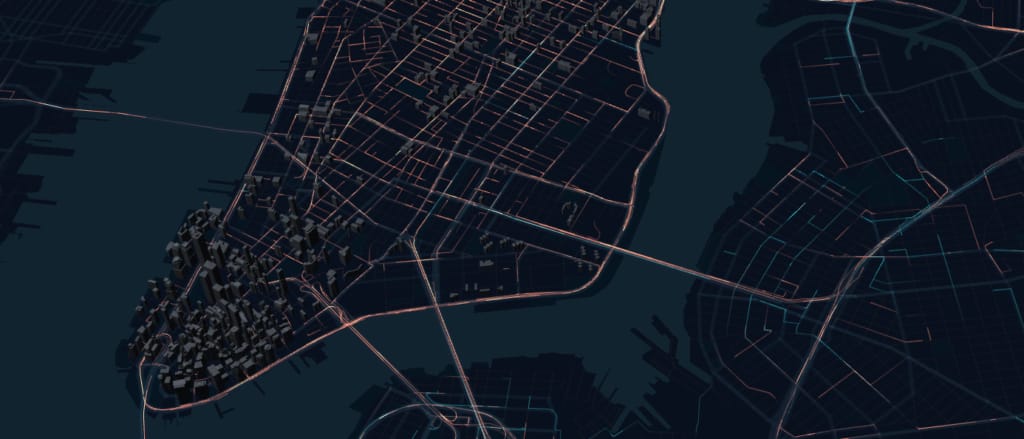
Reliable transportation requires a robust map stack that provides services like routing, navigation instructions, and ETA calculation. Errors in map data can significantly impact services, leading to a suboptimal user experience. Uber engineers use various sources of feedback to identify map errors, for instance, machine learning models to log and understand user feedback, or by evaluating map metrics to improve map quality.
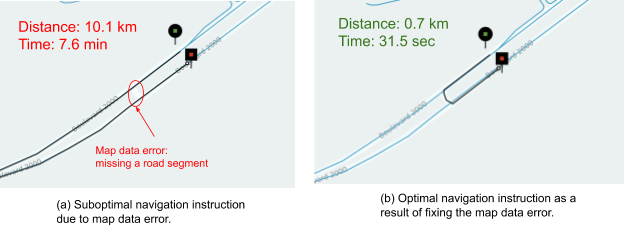
In this article, we discuss another source of feedback: leveraging GPS traces to detect inconsistencies in map data. To demonstrate, in Figure 1, above, we compare two trips starting and ending in the same locations to show how map data errors can lead to substantially longer travel times.
To address this type of issue, we built CatchMapError (CatchME), a system that automatically catches errors in map data with anonymized GPS traces from the driver app. CatchME uses the anonymized and aggregated data from tens of millions of trips across large geographies to catch map data errors. With CatchME, our operators can quickly identify and fix these errors, leading to more accurate routes and improved driver-partner experiences on our platform.
Identifying map errors with GPS
The fundamental idea of CatchME is that Uber trip GPS traces reflect the ground truth. By analyzing the anomalies of road map matching, CatchME identifies the differences between maps and ground truth. These differences are usually caused by map data errors which can be addressed by updating the map.
CatchME’s first challenge is to find out if a driver’s navigation behavior, as recorded by trip GPS traces, shows disparity with our own suggested map routing. We designed CatchME to snap trip GPS traces on map data with the Hidden Markov Model (HMM), enabling the tool to report disparities between expected and actual routes. Instead of traditional map matching that assumes map data is valid, CatchME focuses on finding disparity without necessarily trusting map data.
GPS traces are not entirely accurate, especially in urban environments, so we don’t know the exact location of vehicles on the platform. We put vehicle location probabilities into HMM, and the Viterbi algorithm calculates the most likely sequence of road segments the vehicle drove through based on these traces. With this information, CatchME reports anomalies in traces to this sequence and highlights the difference between driver behavior and the app’s suggested route.
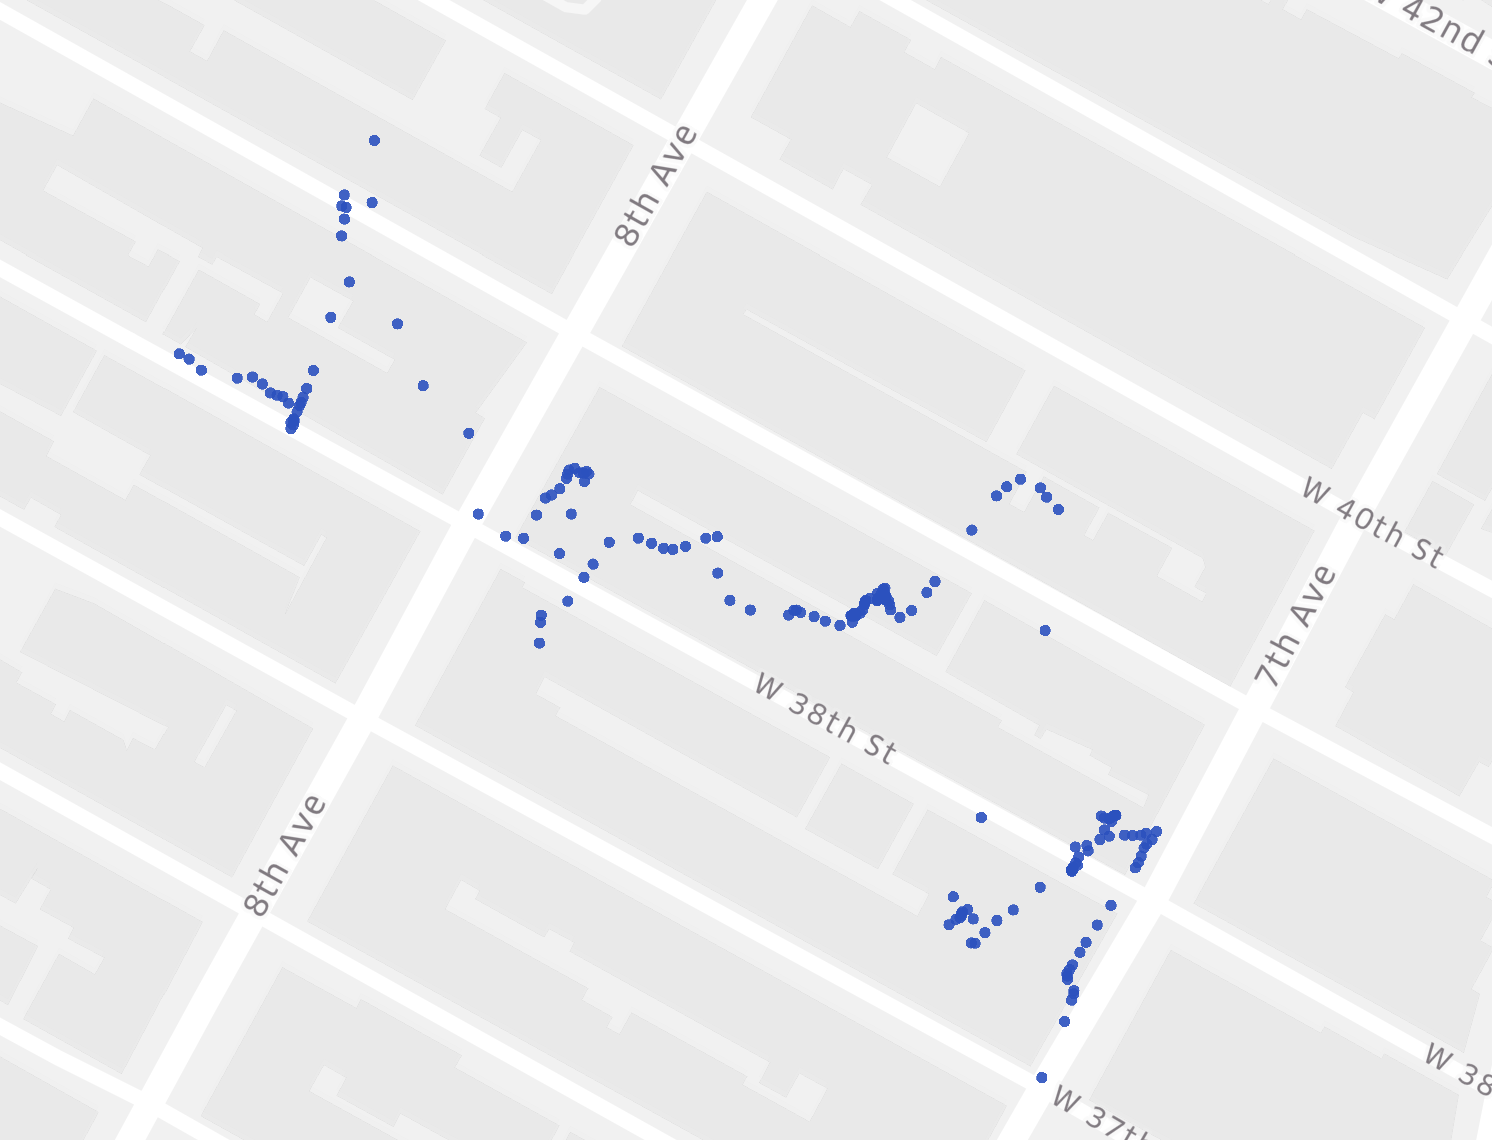
Figure 2, below, depicts an example of how GPS traces can highlight the inaccuracies in our map data. In this case, a route in San Francisco’s Golden Gate Park, (a) shows that a driver turned right at the intersection of 8th Ave and Fulton St, but the driver-partner deviated from (b) the suggested route:

In Figure 2, we find that there is a right turn restriction which discourages driver-partners on the platform from turning right. However, based on driver-partner behavior, we realize that this piece of information in the map may be inaccurate. CatchME visualizes the disparity between our suggested navigation and actual driver behavior, enabling operators to identify and fix the error.
Disparities between suggested routes and GPS traces are not necessarily due to map data errors. Figure 3, below, highlights two other potential causes for these disparities: (a) illegal or dangerous driver behavior and (b) noisy GPS traces that do not provide enough concrete data to clearly determine the route taken.
CatchME error detection algorithm
As discussed earlier, HMM is the bridge that connects trip GPS points with map data. Conceptually, the Viterbi algorithm calculates a path which includes the sequence of most likely states through all possible states in HMM. Ideally, state transitions in this sequence should have a high probability among all possible states. However, this sequence will still include state transitions with low probabilities if there are map data errors. In this context we refer to low probability between states in the sequence as abnormal probabilities.
Emission probabilities (EP) and transition probabilities (TP) will be put in HMM first. Emission probability represents the likelihood of a vehicle present on certain road segments at certain moments. Transition probability represents the likelihood of a vehicle moving from one road segment to another road segment over a certain duration. Hence, for one GPS point with m number of road segments nearby, there will be m emission probabilities representing the likelihood of this GPS trace on each road segment. For GPS points G1, which have m nearby segments, and G2, which has n nearby segments, there are m * n transition probabilities. These probabilities are in HMM, from which the Viterbi algorithm picks up a sequence of states with maximum probabilities that are most likely to represent road segments on which the vehicle was moving.

Figure 4, above, illustrates the factors taken into account for calculating the emission probability of a GPS point on a certain road segment. The formula is outlined below:

where ![]() is the haversine distance between the GPS point and its snap point on the road segment. The emission probability indicates how likely the GPS would be observed if the vehicle is actually on the road segment. (Learn more about emission probabilities in the Microsoft Research paper, Hidden Markov Map Matching Through Noise and Sparseness).
is the haversine distance between the GPS point and its snap point on the road segment. The emission probability indicates how likely the GPS would be observed if the vehicle is actually on the road segment. (Learn more about emission probabilities in the Microsoft Research paper, Hidden Markov Map Matching Through Noise and Sparseness).
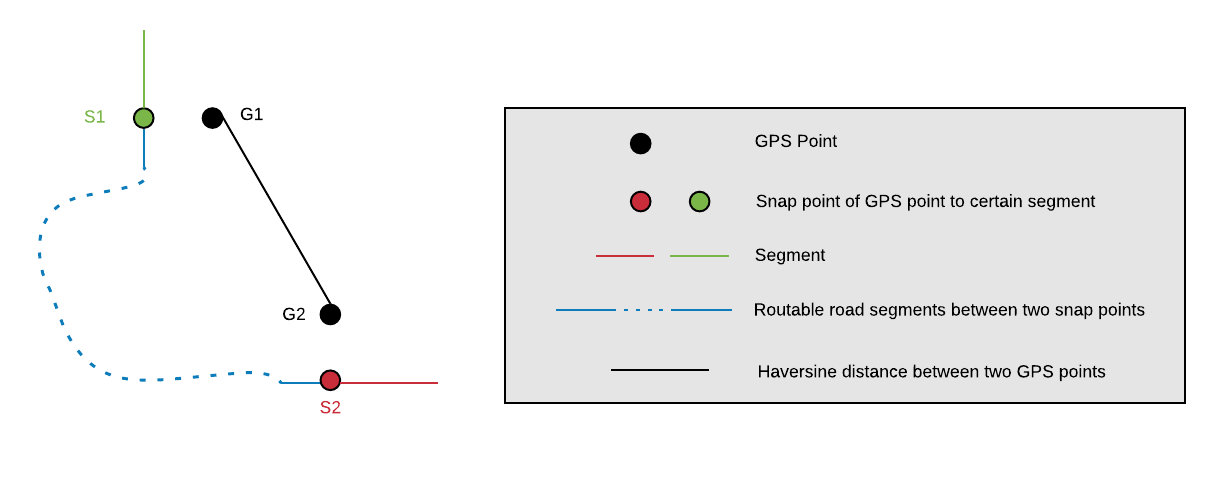
Figure 5, above, illustrates the factors taken into account for calculating transition probability regarding one GPS point![]() on a certain segment
on a certain segment ![]() to another GPS point
to another GPS point![]() on a certain segment
on a certain segment![]() , calculated using the following formula:
, calculated using the following formula:
![]()
where
![]()
![]() is the absolute value of the difference between the haversine distance of two GPS points and the routable distance between two snap points associated with the GPS points. It is less likely that the vehicle was traversing through these two segments when emitting GPS positions if
is the absolute value of the difference between the haversine distance of two GPS points and the routable distance between two snap points associated with the GPS points. It is less likely that the vehicle was traversing through these two segments when emitting GPS positions if ![]() is greater than others.
is greater than others.
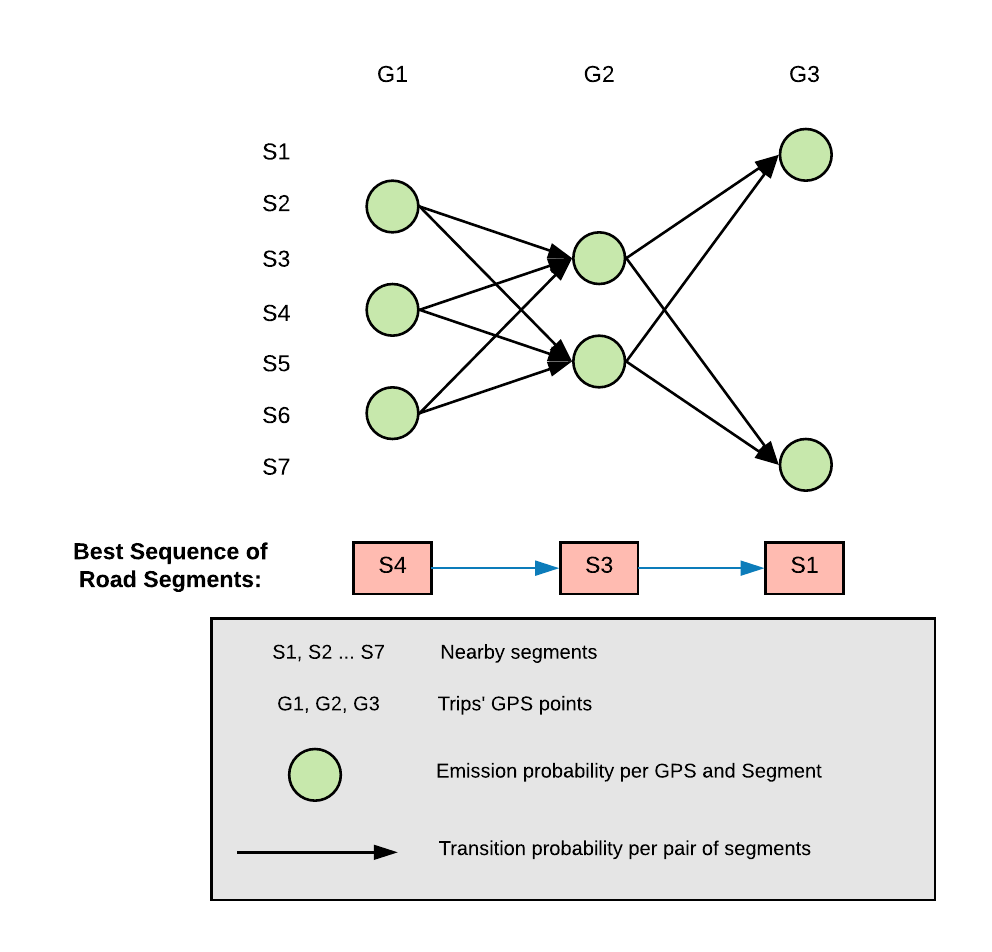
In this calculation, emission probabilities and transition probabilities form a matrix. Viterbi picks up global optimal sequences of road segments with max probabilities that are most likely to be routes that the vehicle was moving on. Figure 6, below, illustrates an example in which G1, G2, and G3 are GPS points, S1 through S7 are segments, green circles are emission probabilities, and black arrows are transition probabilities. After running the Viterbi algorithm, we attain the road segment sequence S4, S3, and S1, and representations of G1, G2, and G3 moving on these sequences.

Normally, the sequence of road segments picked up by the Viterbi algorithm from the HMM represents road segments traversed by a vehicle. However, if our map data has an error, like missing the segment depicted in Figure 7, this sequence will include abnormally low transition probabilities, indicating that the vehicle could not travel on a segment or transit between certain segments within the map data context, even though the vehicle actually did in the real world. This is the disparity in road segment sequences that CatchME is interested in.
CatchME identifies disparities between GPS traces by visualizing suspicious GPS point movements using green and blue colors that indicate an abnormal transition on given routes (Figure 7). In these instances, operators can quickly locate this area and fix these errors (Figure 2).
Scaling for accuracy
Since a disparity between suggested and real-world routes does not necessarily represent an error in map data, catching errors on a given route cannot rely on results from one trip alone. Instead, CatchME uses the anonymized and aggregated data from tens of millions of trips across large geographies to catch map data errors.
CatchME applies the divide and conquer (D&C) approach to scale horizontally across trips. The main goal of D&C is to shard GPS traces and map data so that they can be handled in parallel. Sharding is based on S2 cells of traces and map data. Traces across multiple S2 cells are split into multiple sub-traces, each of which is fully contained by a single S2 cell. Detections run independently in different S2 cells in parallel. Figure 8, below, illustrates this high-level sharding. To guarantee that each S2 cell includes all map data that may be used for detecting errors, we usually extend S2 cell boundaries so that all map data and its associated GPS points are in scope.

However, partitioning trips and map data with static S2 cells sometimes does not provide enough concurrency. For example, S2 cells of certain areas such as the San Francisco International Airport (SFO) have significantly more trips than the same level of S2 cells in rural areas.
To further improve CatchME’s performance, we make multiple copies for each high-density cell. Each of the copies has identical map data but a different and evenly distributed set of trips, as illustrated in Figure 9, below:
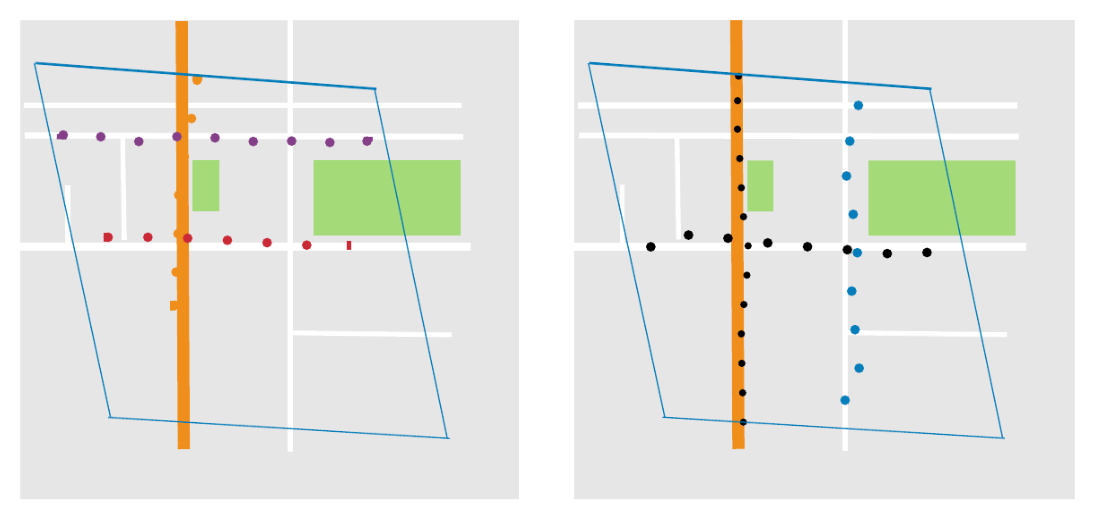
This approach eliminates bottlenecks caused by high-density cells and leads to more accurate results because each cell is still big enough to contain both the full map data context and GPS points for map matching and error detection.
Filtering false alarms
As a result of scaling CatchME, sufficient disparity signals (abnormal probabilities) provide us with a statistical view for evaluating data errors. The philosophy behind aggregating results from a large number of trips is that if we see consistency in abnormal probabilities at a given place reported by trips, the root cause of this disparity is more likely to be a map data error than illegal driving behavior or noisy GPS signals.
Since CatchME has identified differences in terms of abnormal probabilities among GPS points located in certain S2 cells with level 16 size (S2 Cell Statistics), a size averaging 19,793 square meters, CatchME regards each S2 cell as a basic error unit. By aggregating these units, CatchME determines which errors are more likely to impact the user experience on the driver-partner app.
As highlighted by Figure 3(b), disparities are not necessarily errors. CatchME connects GPS points where disparity signals (or abnormal transition probabilities) exist as a polygonal chain (usually this polygonal chain includes around 40 GPS points). If the geometry of this chain is not valid, CatchME will ignore this error signal. CatchME also observes a certain number of false alarms that are due to GPS trace shifts shown by Figure 10, below, where GPS traces cross buildings rather than move close to roads. If these GPS points cross multiple physical buildings greater than a certain threshold, CatchME will ignore this disparity.
Better maps, better user experiences
Although we have just scratched the surface of our team’s work detecting map data errors with passive signals, the results of CatchME have demonstrated a very promising approach. Within the first three months of its launch, CatchME detected more than 28 thousand map errors. Correcting these errors on our maps greatly improved the accuracy of our trip ETAs, navigation, and user experience.
In the future, we plan to further improve CatchME’s precision and recall by enhancing our algorithms and leveraging additional evidence, such as satellite imagery. Combined with the map errors reported by customers, those found by CatchME will facilitate an even more seamless experience on our apps for riders and driver-partners alike.
If you are interested in contributing to Uber’s mapping stack and solving problems that straddle the digital and physical worlds at scale, consider applying for a role on our team.

Yuehai Xu
Yuehai Xu is a software engineer on the Uber Maps team. He is a hacker and is passionate about finding map errors.

Congxiao Lu
Congxiao Lu is a software engineer on the Uber Maps team. He has worked on multiple projects at Uber to improve map accuracy and map error detection.

Suneel Kaw
Suneel Kaw is a product manager on the Uber Maps team. He works on augmenting maps and keeping them fresh and accurate by aggregating geospatial data, building automation to extract information from sensor data, and designing tools and processes to better leverage this data.

Daniel Wolf
Daniel Wolf is a senior staff engineer on the Uber Maps team. He is working on a wide variety of projects related to the Maps infrastructure foundation, serving the routing, search, and map display stacks.
Posted by Yuehai Xu, Congxiao Lu, Suneel Kaw, Daniel Wolf
Related articles

How LedgerStore Supports Trillions of Indexes at Uber
April 4 / Global

Most popular

Load Balancing: Handling Heterogeneous Hardware

Using Uber: your guide to the Pace RAP Program

Balancing HDFS DataNodes in the Uber DataLake
Model Excellence Scores: A Framework for Enhancing the Quality of Machine Learning Systems at Scale
Products
Company
