Introducing LCA: Loss Change Allocation for Neural Network Training
September 10, 2019 / Global
Neural networks (NNs) have become prolific over the last decade and now power machine learning across the industry. At Uber, we use NNs for a variety of purposes, including detecting and predicting object motion for self-driving vehicles, responding more quickly to customers, and building better maps.
While many NNs perform quite well at their tasks, networks are fundamentally complex systems, and their training and operation is still poorly understood. For this reason, efforts to better understand network properties and model predictions are ongoing, both at Uber and across the broader scientific community.
Although prior studies have analyzed the network training process, it still largely remains a black box: millions of parameters are adjusted via simple rules during training, but our view into the process itself remains limited to a scalar loss quantity, which provides a severely restricted view into a rich and high-dimensional process. For example, it may be that one part of a network is performing all of the learning and another part is useless, but simply observing the loss will never reveal this.
In our paper, LCA: Loss Change Allocation for Neural Network Training, to be presented at NeurIPS 2019, we propose a method called Loss Change Allocation (LCA) that provides a rich window into the neural network training process. LCA allocates changes in loss over individual parameters, thereby measuring how much each parameter learns. Using LCA, we present three interesting observations about neural networks regarding noise, layer contributions, and layer synchronization. Fellow researchers and practitioners are invited to use our code to try this approach on their own networks.
Our methods
One way of revealing detailed insights into the neural network training process is to measure how much each trainable parameter of the neural network “learns” at any point in time. Here, we think of “learning” as the changes to the network that drive training set loss down. Note that we consider the loss on the entire training set, not just a batch; while batches drive parameter updates in SGD, we measure learning with respect to the whole training set.
Suppose we are training a network, and during a single training iteration the parameter vector moves from![]() to
to ![]() . Due to this motion, the loss decreases from, say, 1.85 to 1.84. In this case
. Due to this motion, the loss decreases from, say, 1.85 to 1.84. In this case ![]() , and we might say the network “learned” to the tune of a .01 decrease in loss. We can approximate this change in loss via a first order Taylor approximation:
, and we might say the network “learned” to the tune of a .01 decrease in loss. We can approximate this change in loss via a first order Taylor approximation:![]()
It may seem pointless to approximate a quantity that we could just compute directly, but approximation is not our end goal: we use the approximation to break down the change in scalar loss into individual components. In this case, the right side of the equation is a dot product of two vectors with length equal to the number of parameters. We can decompose this dot product into its constituent summands:
where ![]() indexes over the parameter vector or the gradient vector. By measuring this at every iteration of training, we are able to allocate the change in scalar loss to individual parameters. We call this measure Loss Change Allocation (LCA): how much a parameter’s movement at an iteration caused the loss to go up or down. Here are some intuitive properties of LCA:
indexes over the parameter vector or the gradient vector. By measuring this at every iteration of training, we are able to allocate the change in scalar loss to individual parameters. We call this measure Loss Change Allocation (LCA): how much a parameter’s movement at an iteration caused the loss to go up or down. Here are some intuitive properties of LCA:
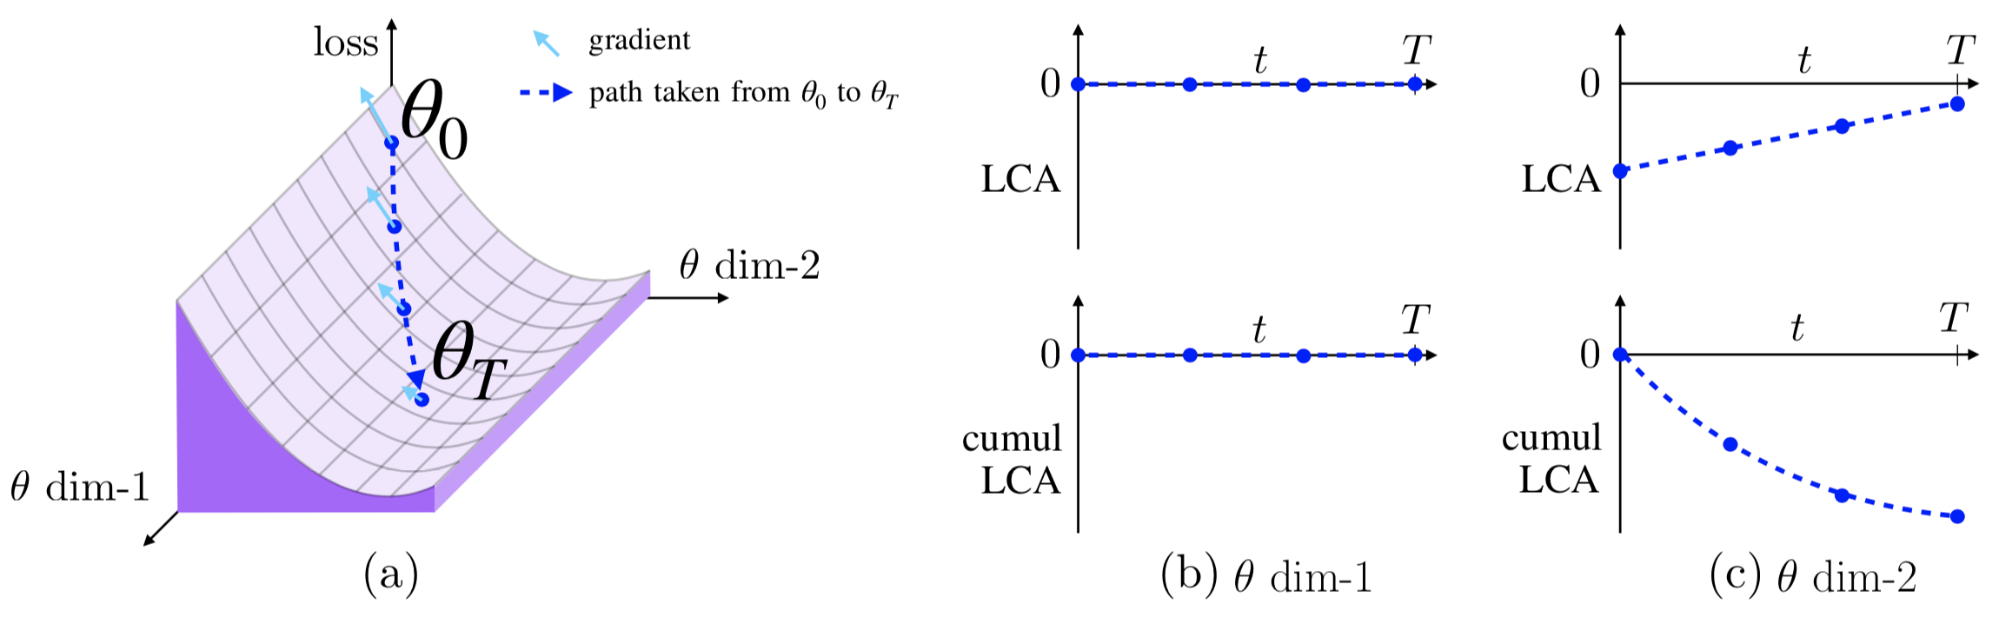
- If a parameter has zero gradient or does not move, it has zero LCA, as depicted in Figure 1b.
- If a parameter has a nonzero gradient and moves in the negative gradient direction, it has a negative LCA, as depicted in Figure 1c. We call these parameters “helping” because they decrease the loss at an iteration.
- If a parameter moves in the positive direction of the gradient, it is “hurting” by increasing the loss. This could be caused by a noisy mini-batch or momentum causing the parameter to move the wrong direction.
LCA components have the great property of being grounded, meaning that they sum to real changes in the loss (with some modifications of the approximation method to take curvature into account and guarantee accuracy, as explained fully in our paper). Throughout the training process, we measure LCA for every parameter and iteration. If we sum over parameters, we get the total change in loss at each iteration, and if we sum over iterations, we get the total LCA of each parameter.
Visualizations through the training microscope
With the LCA measurement defined as above, we can use it as a microscope into the training process for some example networks trained on datasets such as MNIST or CIFAR-10. For MNIST, we train two networks: FC, a three-layer fully connected network, and LeNet, a network with two convolutional layers followed by two fully connected layers. For CIFAR-10, we train ResNet, a 20-layer residual network. All networks in this blog post have been trained using SGD with momentum (see our paper for results from other networks and optimizers).
In the video below, we visualize the LCA data directly, with each frame showing LCA for all parameters on a given iteration. FC is represented in this example, with each pixel representing one parameter, laid out in layers. (See also: video for LeNet.)
Video 1. We animate the first 400 iterations of FC training on MNIST. Green values indicate negative LCA (helping), and red values indicate positive LCA (hurting).
In the video above, we see a few trends:
- Iterations 1-10: at the beginning, loss is decreasing steeply and we see a lot of green parameters.
- Iterations 10-100: after a few iterations, we see a noisy mix of green and red, indicating that some parameters are helping and others are hurting.
- Iteration 100+: once the loss is near its final value, we see that most pixels are close to white, showing that the parameters are no longer helping or hurting significantly.
Section S2 in our paper provides more examples of direct visualizations. Such visualizations are appealing and could help surface bugs or identify dead neurons and useless parameters, but it’s difficult to derive more quantitative conclusions from them. To better understand higher level LCA patterns, we next try a few quantitative aggregations.
Result 1: Training is noisy
The first aggregation we consider is the distribution of LCA values over all parameters and all iterations. Figure 2, below, shows the LCA distribution for ResNet, with green bars representing components that helped loss and red bars representing components that hurt it:
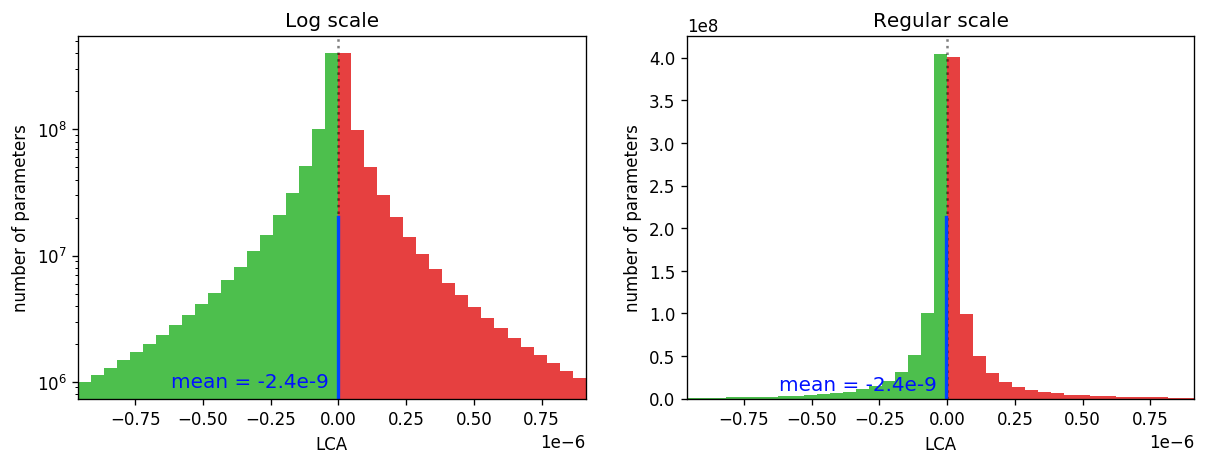
The LCA distribution has a couple of interesting properties. Before making this plot, we already know what the mean of this distribution has to be: the average LCA is just (total change in loss) / (number of parameters * number of training steps). For the run in Figure 2, the mean is -2.4e-9, highlighted by the blue line. Given that the mean is -2.4e-9, we may have expected a narrow Gaussian distribution around that value. What we see instead is a very wide distribution. In fact, it’s so wide that at this level of detail its mean is indistinguishable from 0. This implies that rather than all network parameters collaborating in a single direction pushing the network toward lower loss, the training process is rife with competition between parameters that help and those that hurt. LCA is also heavy tailed: if it were Gaussian-distributed, the histogram in log space would take the shape of an inverted parabola.
We can quantify this tension by calculating the percentage of weights that helped (green) as opposed to hurt (red). We find that only 50.7 percent of weights helped on a given iteration for this network. In other words, barely more than half of all parameters are helping at any given time as the network trains; the rest are moving in the wrong direction!
The surprising amount of positive LCA—parameters moving in the wrong direction—raises some additional questions:
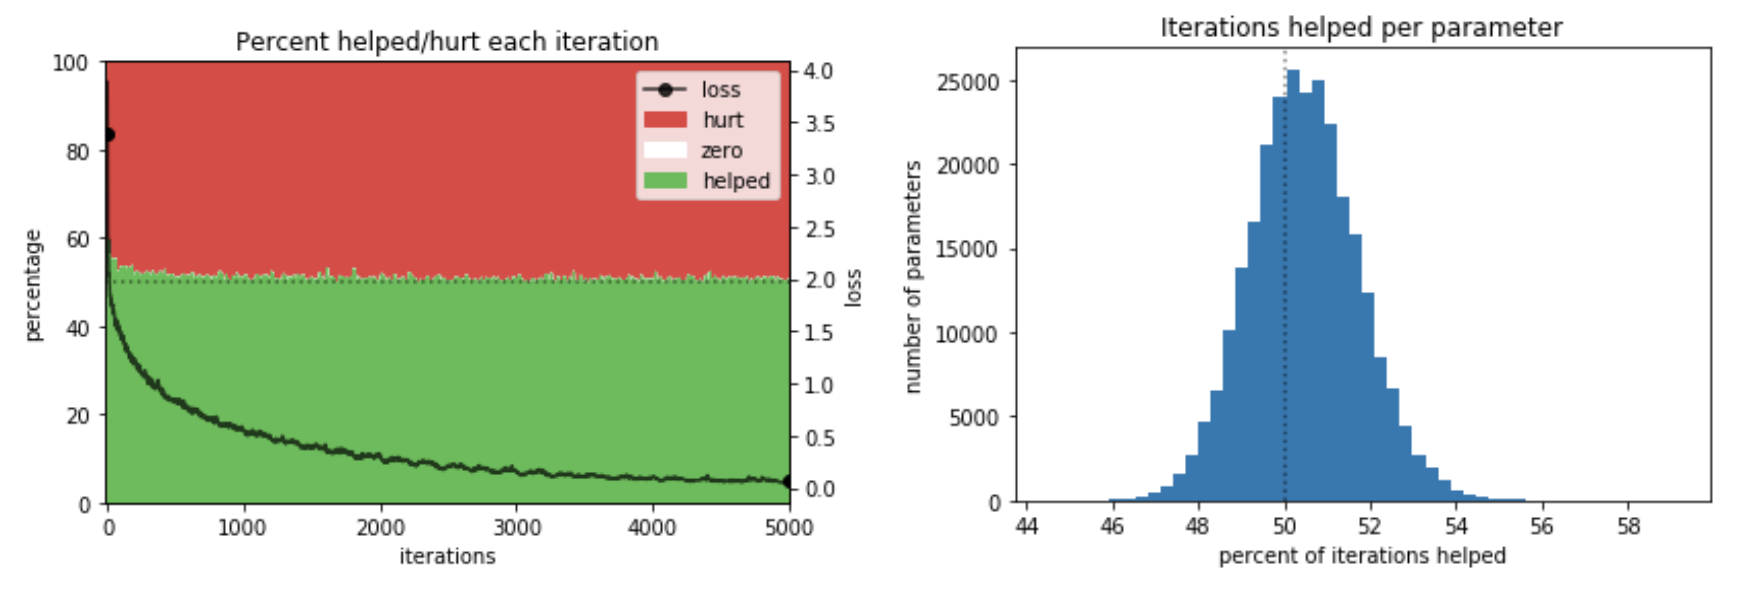
- As we train a network longer and longer, loss will eventually stop decreasing, and the percent of parameters that help would conceivably converge to 50 percent. Therefore, we ask: does this nearly 50 percent ratio arise simply because the network was trained for too long? Figure 3a, below, demonstrates that this is not the case: the ratio is only slightly above 50 percent at most points during training, and slightly higher but still less than 60 percent during the early iterations of steepest learning.
- Next, given that many parameters helping are opposed by many parameters hurting, we ask whether some parameters help all the time, and if so, are they offset by others hurting all the time? In other words, are there some “hero” parameters that help almost all the time, opposed by “villain” parameters that do constant damage? Figure 3b shows that there are not: the parameters that help most often help only 53 percent of the time, and the parameters that help least often still help 48 percent of the time.
These two observations may be explained in large part by the prevalence of oscillation during training. In Figure 4, below, we show the motion, underlying gradient, and resulting LCA over time of two example parameters. You can clearly see oscillation in these charts:
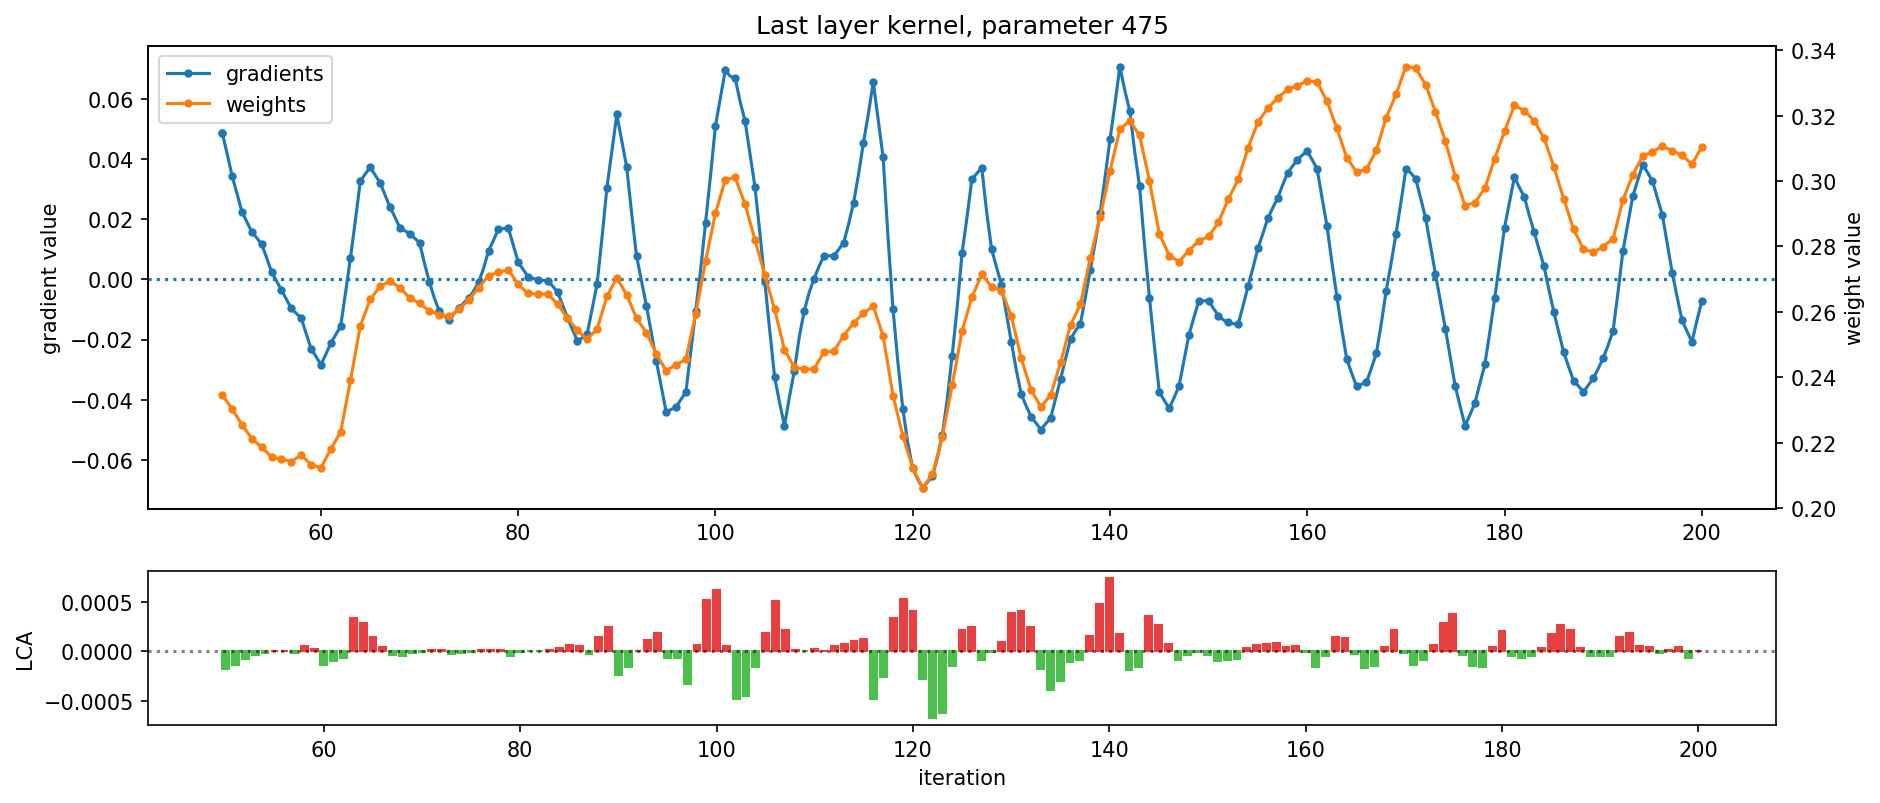
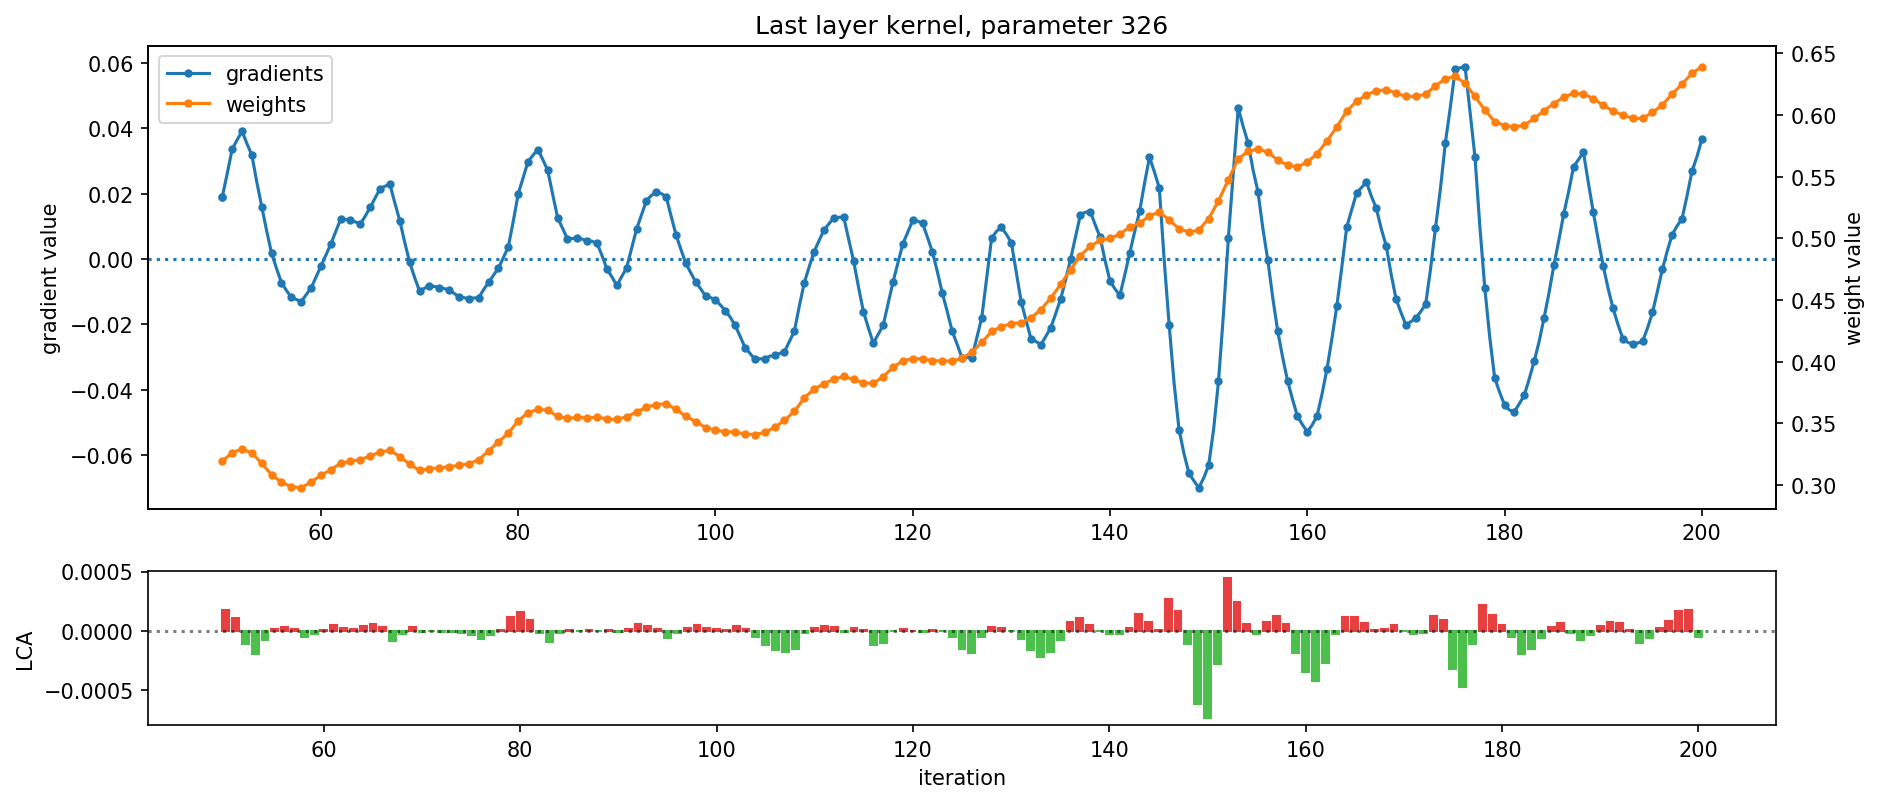
In addition to oscillating weights and gradients, Figure 4 also reveals that a parameter’s motion and underlying gradient tend to fluctuate together. This suggests that oscillations are driven by parameters swinging back and forth over local minima rather than by mini-batch noise.
Although only two parameters are shown in Figure 4, oscillation is pervasive throughout training and the network at large: for instance, during the run depicted, weight values changed direction every 7 iterations on average, and the gradient changed sign every 10 iterations. In fact, even if we adjust learning rate, batch size, and momentum within values that allow the network to train reasonably well, we still observe prevalent oscillations and measure that nearly half of parameters hurt (see our paper for details).
Through these experiments LCA reveals the first insight about neural network training: at any given time nearly half of parameters are hurting, or traveling against the training gradient. The network learns overall only because the average of the many noisy LCA components is slightly negative.
Result 2: Some layers go backwards
Although we can use our method to study low-level, per-parameter LCA, we can also aggregate LCA over higher level breakdowns. We expect to see different insights this way; there is a lot of noise on the parameter level, but on the whole, the network learns. One way to aggregate LCA is to sum over all parameters within each layer and over all time. This measures how much each layer learns over the course of training, shown for two networks in Figure 5, below:
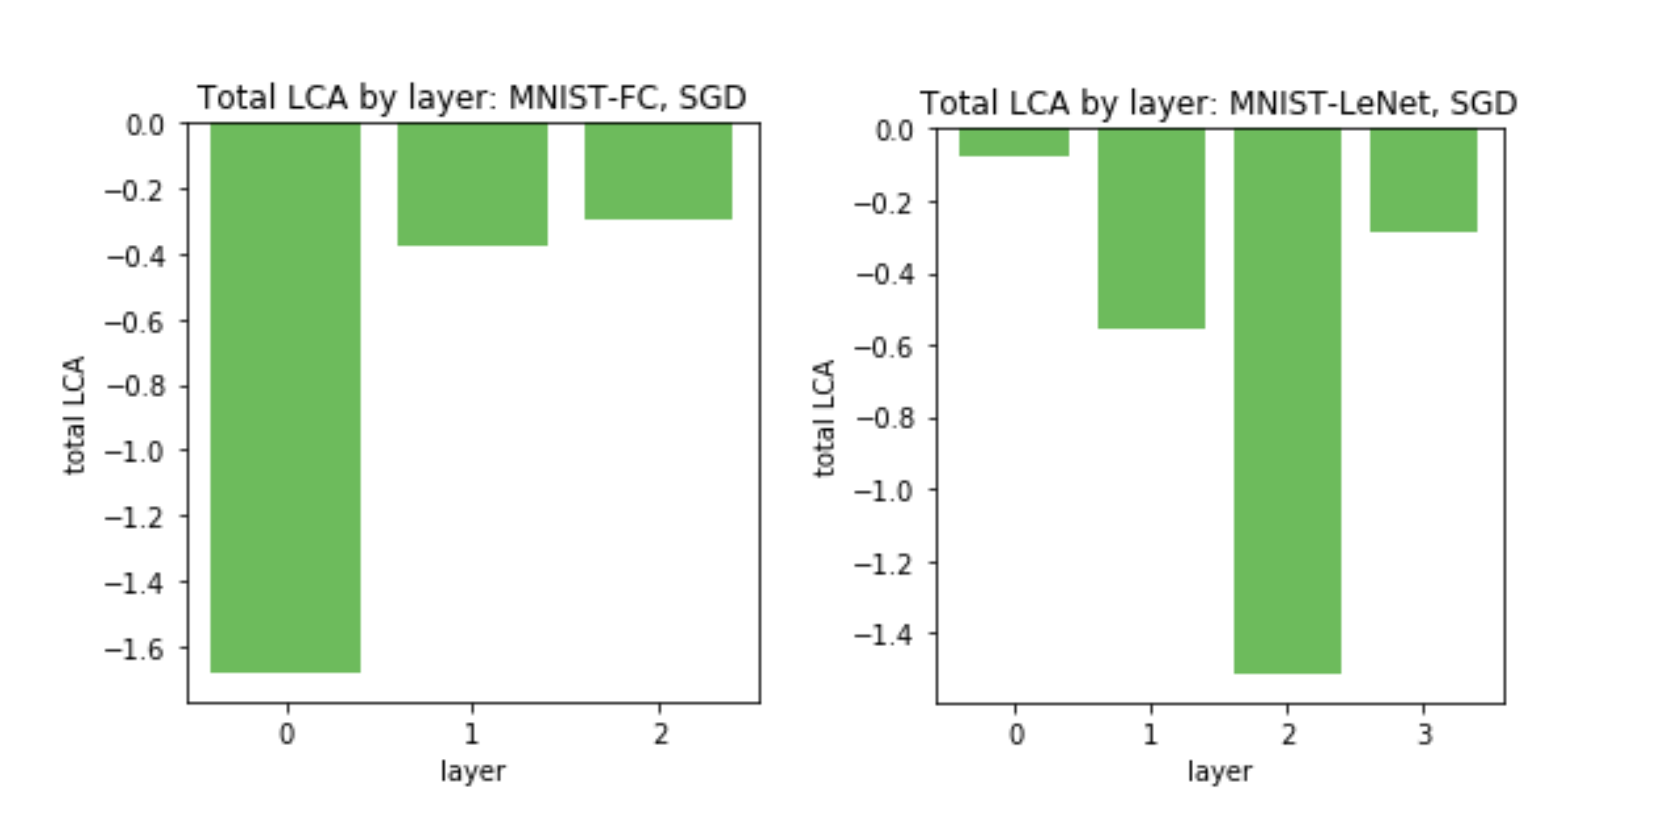
If we normalize each layer’s LCA by the number of parameters, unsurprisingly, we see an inverse effect, where parameters in smaller layers have more LCA on average. Next, we look at ResNet to see if it exhibits different behavior:
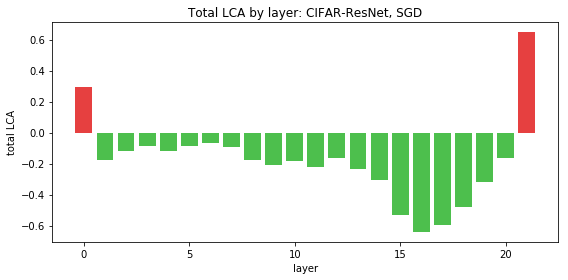
While FC and LeNet don’t reveal any surprising conclusions, we notice something abnormal about ResNet. The first and last layers have positive LCA, meaning that their movements actually increased the loss over the training process! Though we have observed individual parameters hurting, we expect LCA to be negative when summed over large groups because the average LCA is negative. However, this is not the case for these hurtful layers, which consistently had positive LCA every run (and p-value < 1e-4 for 10 runs).
With this strange result, we wondered: if a layer hurts, what if we freeze the layer at initialization? By preventing the weights from moving, we can stop it from either hurting or helping. Would this make the network perform better overall? We tried this technique with the first layer, but the resulting loss was not better: even though we prevented the first layer from hurting, the other layers were not able to help as much. For this reason, the parameter motion of the first layer is important despite its positive LCA. However, if we freeze the last layer, depicted in Figure 7, it improves overall network performance, resulting in lower overall loss.
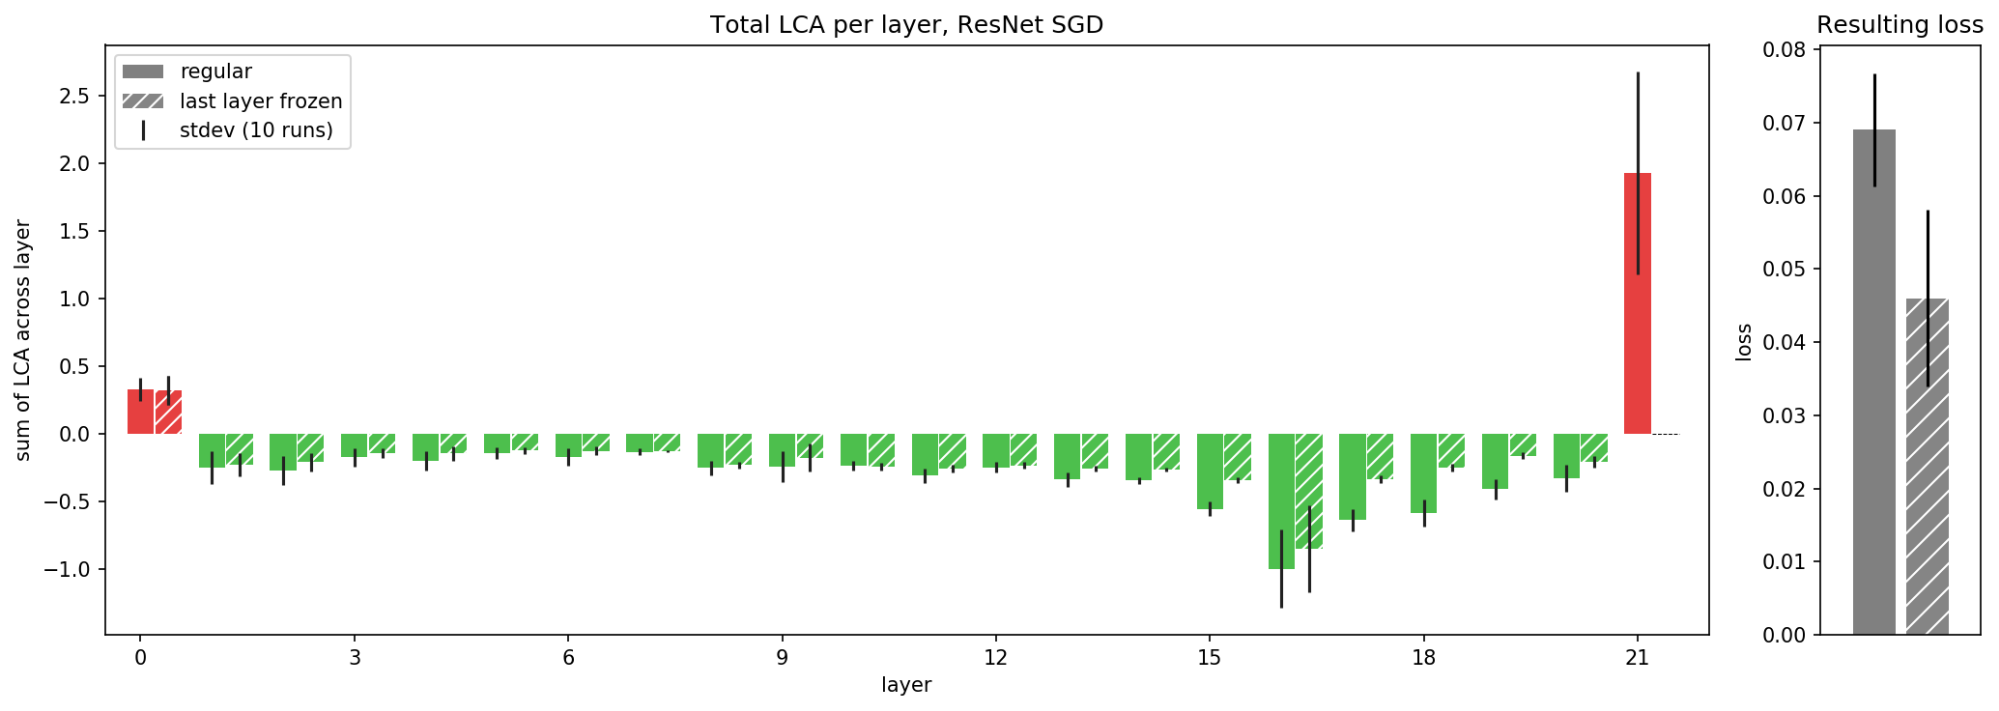
These results indicate that the last layer is better off frozen. Previous studies have found benefits to freezing the last layer or treating it differently. LCA provides a principled hint that the last layer may be better off frozen as well as an explanation for what was going wrong with it in the first place: it was hurting on average.
To understand why a layer would hurt in the first place, we consider a few possible causes. The mini-batch gradient is an unbiased estimator of the whole training set gradient, so mini-batch noise on its own does not explain positive total LCA. The parameter oscillation we observed earlier is another potential explanation, but absent other factors, oscillations should not cause drift in the wrong direction, so this does not account for positive total LCA either.
After ruling out these options, we hypothesize that the explanation has to do with the speed at which different layers respond to the optimizer. If, due to a convergence of factors, layers learn with different latencies, the last layer could be constantly lagging behind other layers, slightly out of phase with them. As layers race to minimize the loss, the delayed last layer could lose out on collecting LCA.
Fortunately, we can test this hypothesis by directly adjusting each layer’s delay through the optimizer’s momentum. Since the momentum ![]() is an exponential weighted average of the past gradients, the average gradients we use are
is an exponential weighted average of the past gradients, the average gradients we use are ![]() iterations old. Thus far, we have been using momentum 0.9 for every layer, corresponding to a delay of 9 iterations; a momentum of 0 would have a delay of 0. If we decrease the momentum of just the last layer, we are able to decrease the relative delay of the last layer compared to the other layers.
iterations old. Thus far, we have been using momentum 0.9 for every layer, corresponding to a delay of 9 iterations; a momentum of 0 would have a delay of 0. If we decrease the momentum of just the last layer, we are able to decrease the relative delay of the last layer compared to the other layers.
We can run the same network with varying levels of last layer delay, from 0 to 9 iterations, while we hold all the other layers at a constant delay of 9. As hypothesized, the less the last layer is delayed, the more it helps! The transition from hurting to helping is almost linear with respect to delay. Furthermore, as the other layers are more delayed with respect to the last layer, they hurt more as they now lag behind and the last layer pulls ahead, as depicted in Figure 8, below:
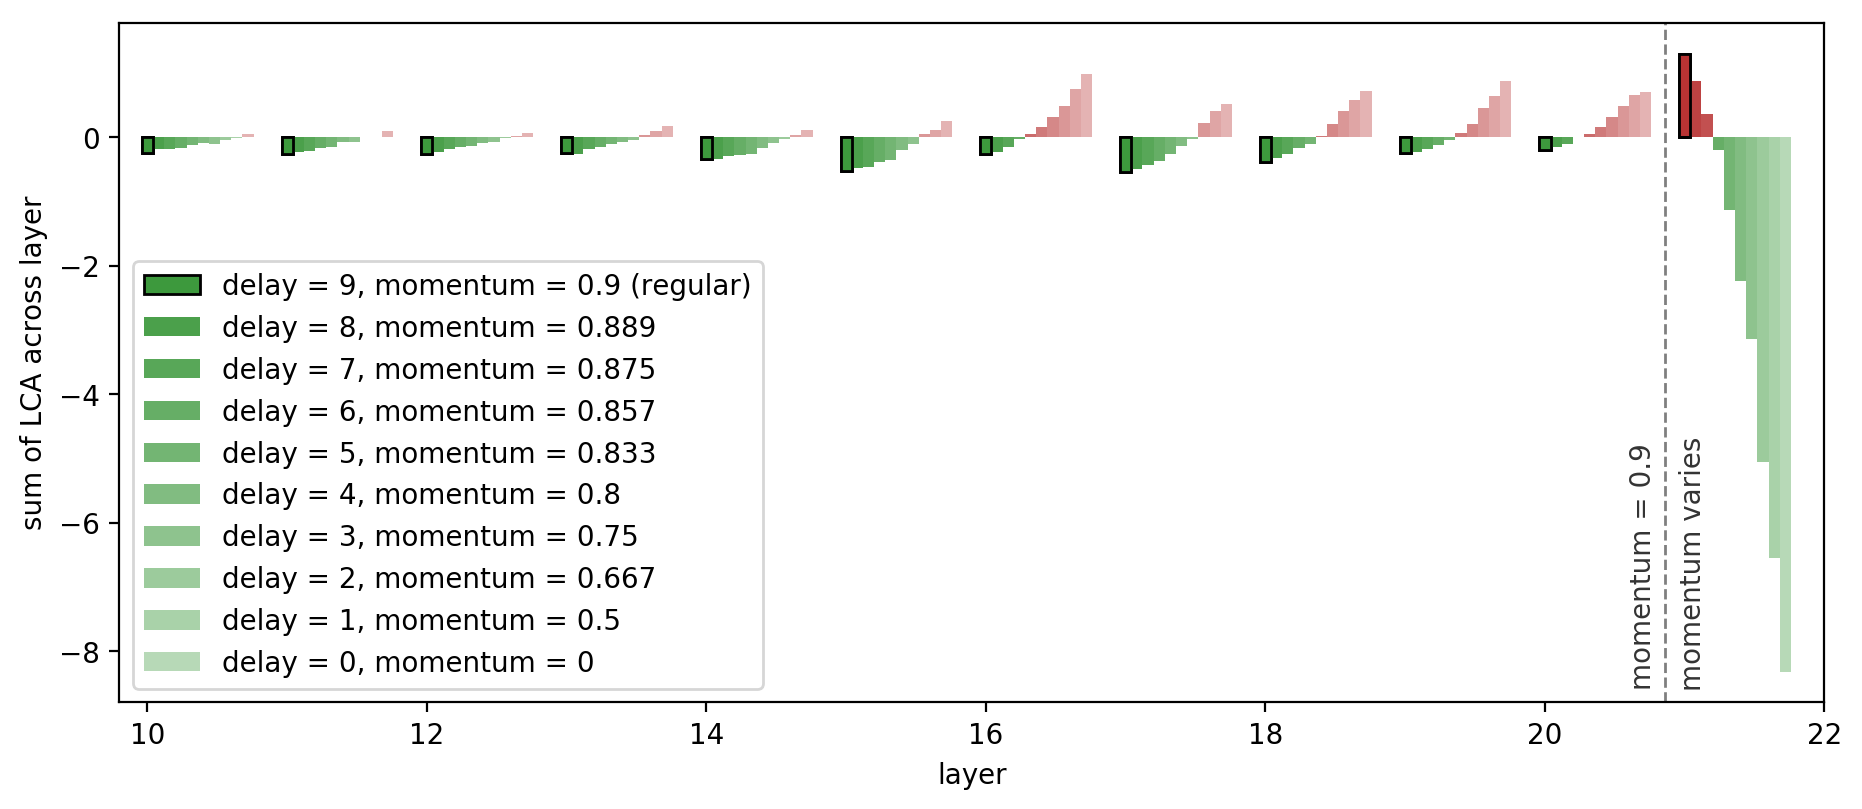
From these experiments, LCA reveals that different layers behave differently, with some even moving against the gradient on average and hurting. Viewing training through the lens of information delay seems valid. Together, these results suggest that per-layer optimization adjustments may be beneficial.
Result 3: Layers are synchronized
Now that we have looked at the total learning for each layer, a natural next step is to investigate when the different layers learn. Prior studies have discerned broad patterns of convergence of layer representation, but by using LCA, we can examine layerwise learning on a smaller scale.
A useful property of the LCA method is that it allows us to analyze any loss function we care about. We can use this to our advantage by breaking the training set loss into 10 separate losses (one for each ground truth class), affording us a more granular view into the training process and allowing us to identify when each layer learns concepts useful for classifying (in this case, each class of MNIST).
In order to pinpoint learning with high temporal resolution, we define a “peak moment of learning” for a layer and a class as a local minimum of LCA for that layer and class. In other words, the loss for that class decreased due to the motion of that layer on iteration t more than it decreased due to the motion on iteration t+1 or t-1.
We plot the top 20 peak moments of learning for every layer of MNIST-FC and every class in Figure 9, below:
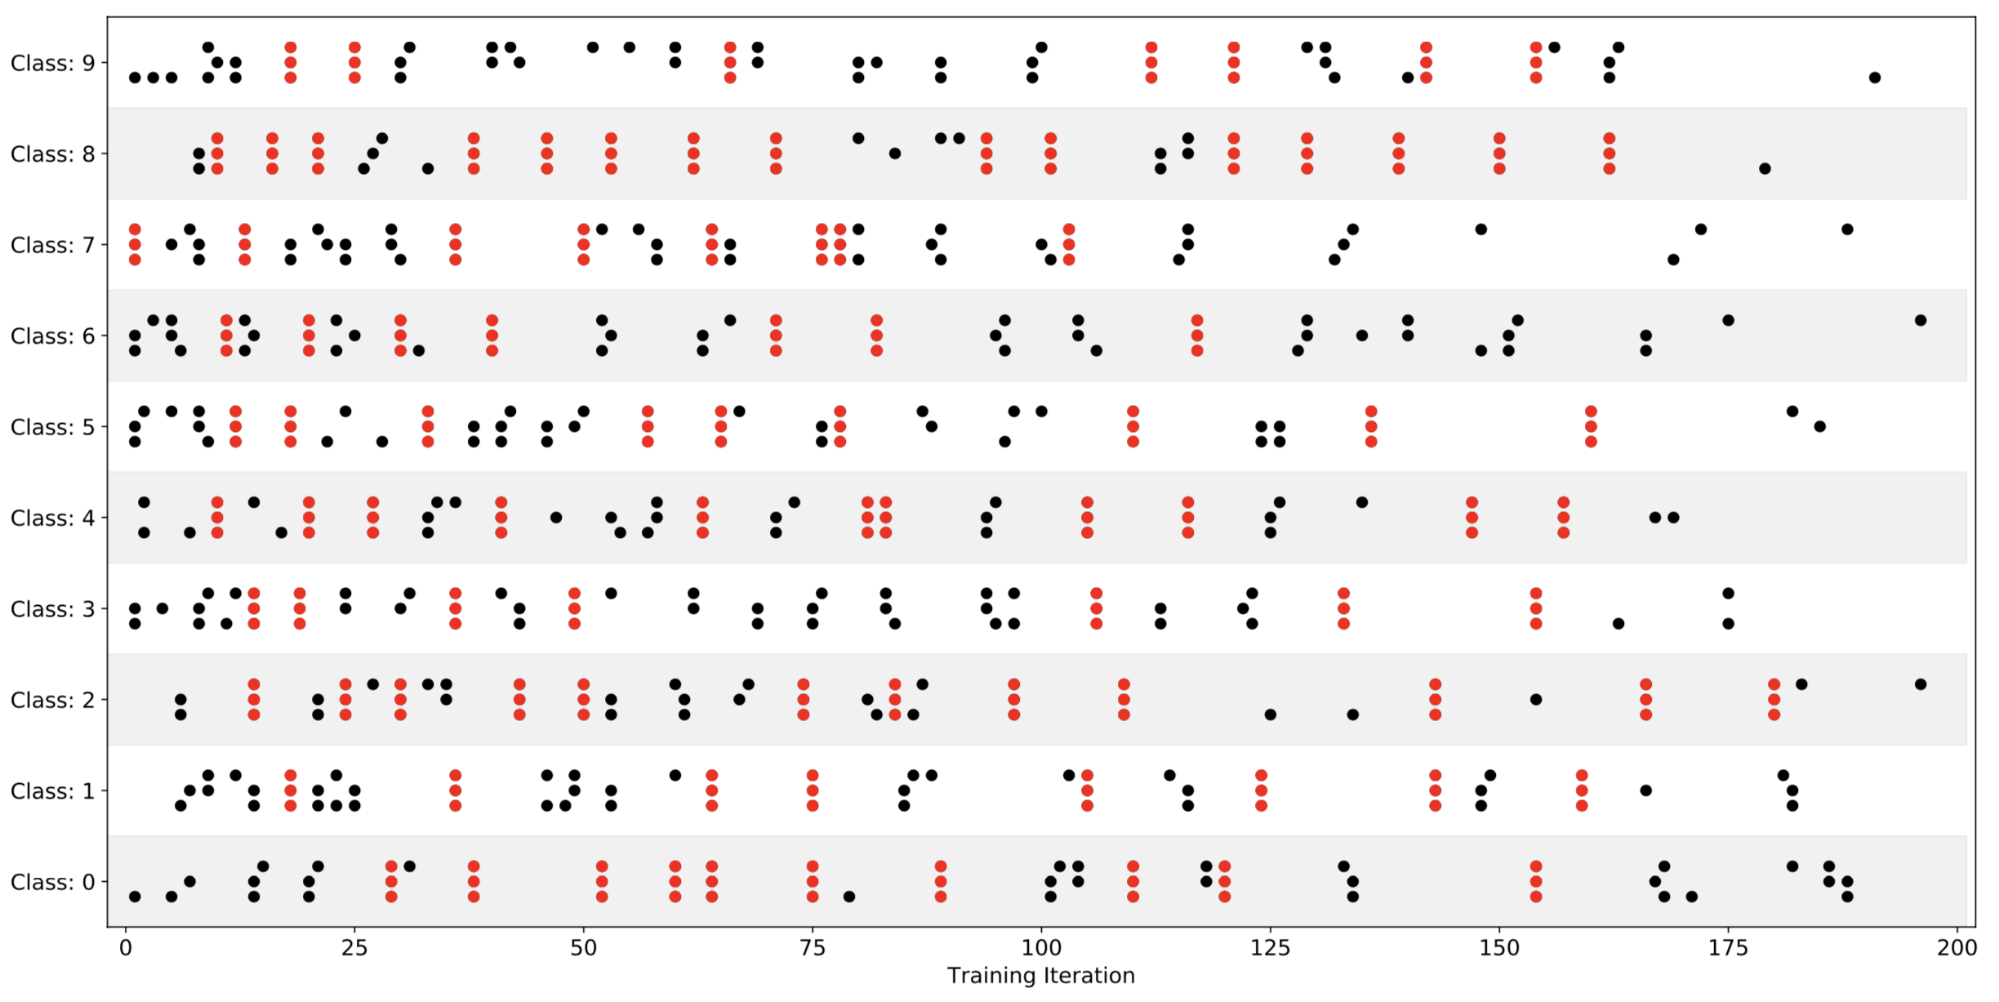
Curiously, we often see sets of three points in a straight line (highlighted red for visibility), which means that all three layers learned something for the same class at the exact same iteration. The average number of precisely aligned peak moments of learning is significantly higher than the expected number if we assume layers progress independently (p < 0.001).
Synchronization of these points cannot simply be explained by individual batches causing large, synchronous changes in the network because while weight movements are also synchronized (Figure S18 in our paper), iterations of peak weight motion and peak LCA generally do not coincide. The gradients per layer and class are also synchronized (Figure S15 in paper), which is another surprising observation: the loss of the per-class training set becomes steep with respect to all layers at the same iteration, which certainly contributes to making synchronized learning possible.
This brings us to our final takeaway: layer learning is synchronized on a micro scale.
Conclusions and future work
We’ve introduced the Loss Change Allocation (LCA) method and demonstrated that by aggregating LCA in various ways, we can uncover the noisiness of training, discover the strange flow of certain layers against the gradient, and reveal the cross-layer synchronization of incremental learning.
In our paper, we elaborate on our findings, analyze more networks and optimizers, and discuss where this work could lead. For example:
- All experiments discussed so far use the training set. If we track validation LCA as well, we can compare training LCA and validation LCA to measure which parameters contributed to overfitting. This analysis could enable targeted regularization.
- LCA can be used to identify weights that are not helping and therefore are targets for pruning or re-initialization.
- Beyond identifying layers to freeze, LCA may be an important diagnostic tool for identifying suboptimal hyperparameters or poorly configured network architectures.
- Better optimizers might be able to take into account the frequent parameter-level oscillations or implement adjustable per-layer hyperparameters.
The possibilities are numerous, and LCA can be used on any parameterized model. If this work interests you and you would like to learn more, check out our paper, use our code to experiment with your own networks, and if you would like to work on these sorts of research challenges with Uber AI, apply for a role on our team.
We look forward to learning about any additional ideas you may have for applications of LCA!
Check out Uber AI’s latest research at www.uber.com/blog/research/.

Janice Lan
Janice Lan is a research scientist with Uber AI.

Rosanne Liu
Rosanne is a senior research scientist and a founding member of Uber AI. She obtained her PhD in Computer Science at Northwestern University, where she used neural networks to help discover novel materials. She is currently working on the multiple fronts where machine learning and neural networks are mysterious. She attempts to write in her spare time.

Hattie Zhou
Hattie Zhou is a data scientist with Uber's Marketing Analytics team.

Jason Yosinski
Jason Yosinski is a former founding member of Uber AI Labs and formerly lead the Deep Collective research group.
Posted by Janice Lan, Rosanne Liu, Hattie Zhou, Jason Yosinski
Related articles


Most popular
Scaling AI/ML Infrastructure at Uber

Information for driving during the week of Super Bowl LVIII

Uber Reveals 2023 “Airport of the Year” Award Winners

DataCentral: Uber’s Big Data Observability and Chargeback Platform
Products
Company
