Using GraphQL to Improve Data Hydration in our Customer Care Platform and Beyond
August 28, 2019 / Global
When a customer contacts Uber with a support issue, we want to quickly and seamlessly address their concerns.
To make the customer support ticket resolution process as streamlined as possible, our Customer Obsession Engineering team designed and developed a new web application to help solve customer support tickets with aggregated data hydrated across Uber’s tech stack. We designed a backend library to handle the data hydration, fetching and adapting different pieces of data to complete the contact object. While the back-end data library worked well with just a few dozen services, as more lines of business onboarded onto the platform various technical pain points arose, including a slowdown in developer velocity, fan-out complexity, and error handling.
After considering multiple replacement hydration solutions, we landed on GraphQL, an open source query language for APIs. GraphQL can interpret the structure of our data sources and delivers only the information needed to resolve an issue, reducing throughput on our Customer Care Platform.
Integrating GraphQL significantly decreased the amount of code engineers have to write to add new features, streamlining the development of these features to benefit Uber’s users. It also made it possible to source contributions from software engineers across Uber without requiring extensive training, allowing us to increase developer productivity.
Sourcing data
Our Customer Obsession agents typically review a dashboard full of information when they resolve customer support tickets. We call this the solution context because it gives them the data they need to determine the path to a successful resolution.To personalize each interaction with our support agents, the platform builds the solution context from a large set of available data, such as trip destination or route, payment type, and whether the customer is a driver-partner, rider, eater, or restaurant, to name a few categories.
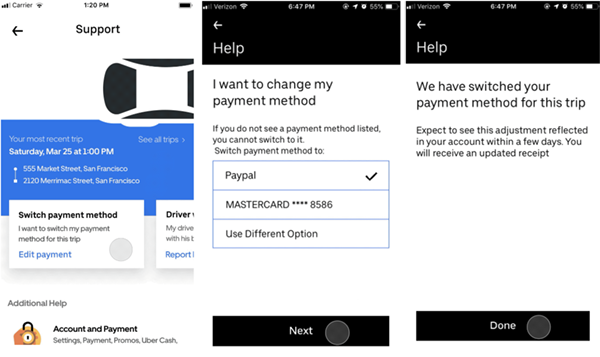
The solution context can help us determine if the issue can be resolved automatically or if it requires additional information procured via a series of in-app screens. A successful resolution may also require intervention from one of our support agents over the phone. Figure 1, below, provides an example of an automated resolution as a user navigates the mobile Uber app to change their payment method:
Given that Uber uses a service-oriented microservice architecture, we have to hydrate (translating the responses from upstream services to fill in our data model) the data used to resolve customer support issues from over 100 upstream services. Our global business has grown to include Uber Eats, Uber Freight, Jump e-bikes, and more, so having one consolidated view of a customer’s interactions with different business units and products is important for ensuring an optimal user experience on our platform. For example, a customer can be both a driver-partner and an eater, as well as a business traveler who uses UberX in the U.S. but Uber Premium in India. Our Customer Care Platform needs to call the most relevant data within the context of the support issue being discussed.
As we grew to support 14 million trips per day, our original data hydration tooling began showing limitations. The number of data sources and contributors further stretched our hydration service. We also had to factor in re-integrating back-end services rewritten to create new features and respond to our rapid growth.
Pain points in our old data hydration layer
Our Customer Care Platform relies on a back-end library written in JavaScript called Contact-Context-Service (CCS). CCS fetches information from upstream services and hydrates the data based on different requirements. Each upstream service has a corresponding context fetcher or middleware. Context fetchers work well for simple data fetching, such as for information on vouchers and promotion, but we use middleware to handle fan-out to multiple fetchers for more complicated data hydration. For example, to gather information for invoices, we have to send and receive data from our payment service, geo service, and others.
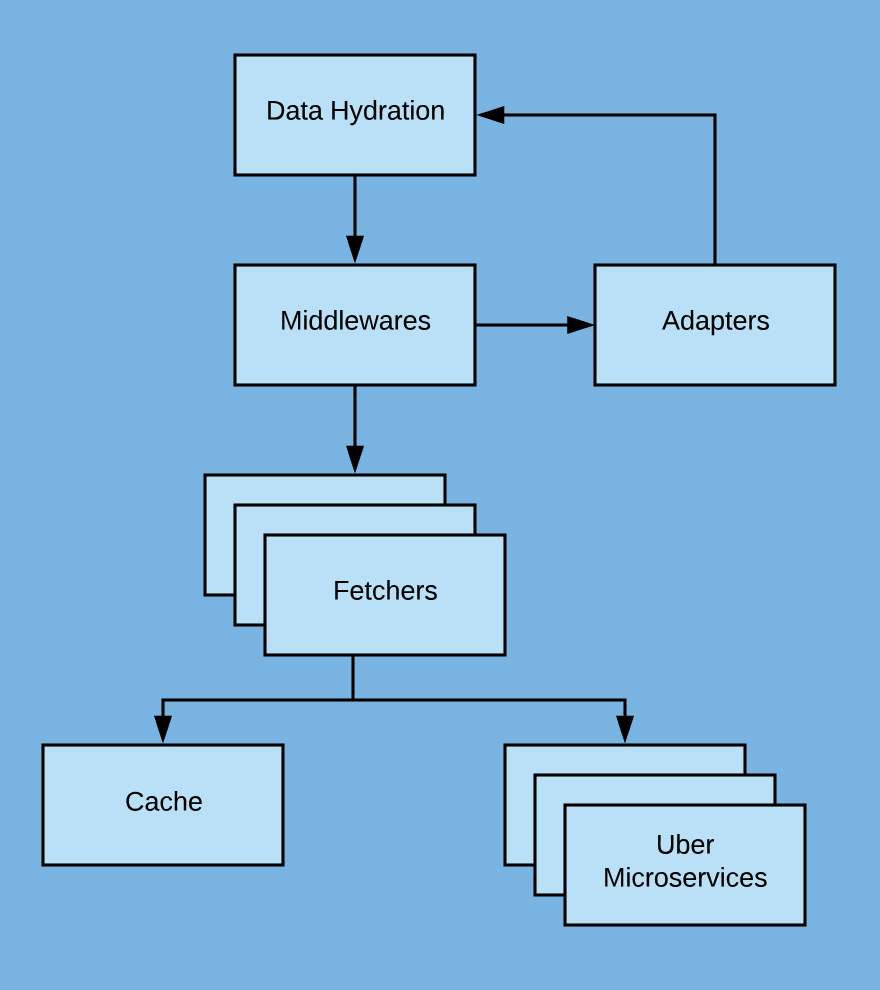
To improve fetching efficiency and performance, we configured CCS with Redis and memory caching. If CCS finds that neither a memory cache nor a Redis cache is available, context fetchers then invoke a remote procedure call (RPC) via HTTP or TChannel. The response data is then processed through middleware and adapters and returned to the service module in callback functions, as shown in Figure 2, below:
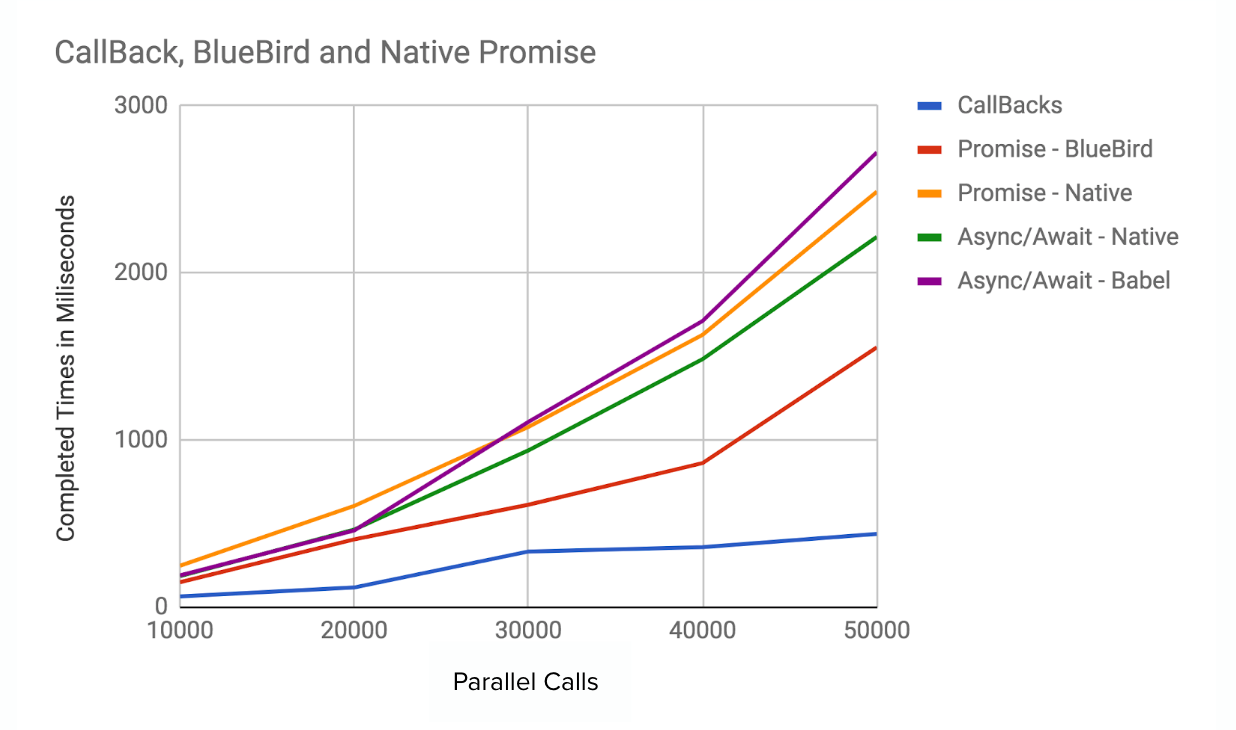
The CCS fan-out mechanism utilizes async.parallel and callbacks. The advantage of this approach is that it requires less memory and fewer call stacks compared to Promise and Async/Await, as shown in Figure 3 below:
However, we found that the fan-out mechanism’s deeply nested callbacks made the code very difficult to track and trace. As Uber’s business grew, the ever-expanding number of layers in the CCS architecture began to slow down developer velocity. Furthermore, as the data model grew, adding a new data field required a comprehensive understanding of the entire data structure to determine whether to serialize or parallelize the new call. Overall, the old design made for an inefficient use of resources.
As our Customer Care Platform further integrated with more business units and products, it was important to address key pain points, such as:
Fan-out complexity
To improve hydration latency, we needed to identify which endpoints we could parallelize or serialize. Whenever we added new data or re-architected the end point, we had to repeat this process, which required excessive engineering resources.
Developer velocity
Our Customer Care Platform has more than 40 contributors from our Customer Obsession team and others at Uber. As shown in Figure 1, above, engineers on the previous version of the platform had to implement multiple layers. Each time we onboarded a new service, we had to create new upstream service proxy clients, middleware, adapters, and tests for each layer. This onboarding process was time-consuming for developers.
As our data model grew, we experienced outages due to our deeply nested fields from the CCS layer. It became increasingly difficult to identify the specific field a given request needed to retrieve from CCS. This made it more difficult to detect outages and had a negative impact on the customer experience when we could not quickly identify and remedy the root cause.
Data hydration sourced basic information from fields shared between our driver-partner, rider, and delivery-partner data models. However, with CCS, we had to retrieve duplicate fields from each of the three data models, creating unnecessary work.
Error handling
The nature of Uber’s microservices architecture introduces surprises when upstream services change their response without testing against downstream services. Using CCS, we had to manually analyze each new upstream endpoint to ensure it was compatible downstream. We also had to constantly update all non-backward-compatible changes from upstream services to ensure proper error handling. It became especially difficult to maintain consistency as our Customer Care Platform scaled up.
Why GraphQL?
To address these pain points, we began assessing more robust data hydration strategies. We considered building a graph layer on top of Uber’s in-house service communication layer to fetch user data. However, after we researched other options, including GraphQL, we realized that building our own graph layer would be unnecessary.
GraphQL, used by many in the industry, is an open source tool that provides a complete and understandable description of the available data in an API. This functionality makes it easier to evolve APIs over time, optimizes error handling, and supports GraphQL Playground, a user-friendly and interactive developer tool that lets us visualize schemas and run test queries locally.
GraphQL’s major advantage comes down to its declarative data fetching. In our use case, the Customer Care Platform’s web-based front-end application queries the GraphQL server for specific data. The server, knowing the entire schema, can resolve the query based on the applicable resolver(s), delivering exactly the data requested.
GraphQL does not fetch any more data than it needs to satisfy a query, minimizing stress on upstream services or sources. The GraphQL API ensures that the server returns the exact, structured responses required with no unnecessary additional information attached.
Using GraphQL significantly decreases the amount of code that engineers have to write to add new services and endpoints. Instead of a proxy client, fetcher, middleware, and adapter, engineers only need to write fetching logic once in the resolver, removing all the unnecessary client, fetcher, and middleware files in the old architecture.
Integrating GraphQL with the Customer Care Platform
In order to integrate GraphQL with our Customer Care Platform frontend, our engineers first had to define a set of schemas on a GraphQL server. Each type of field defined in the schema also needed a function, or a resolver to call the request to upstream services and map the response to corresponding schemas.
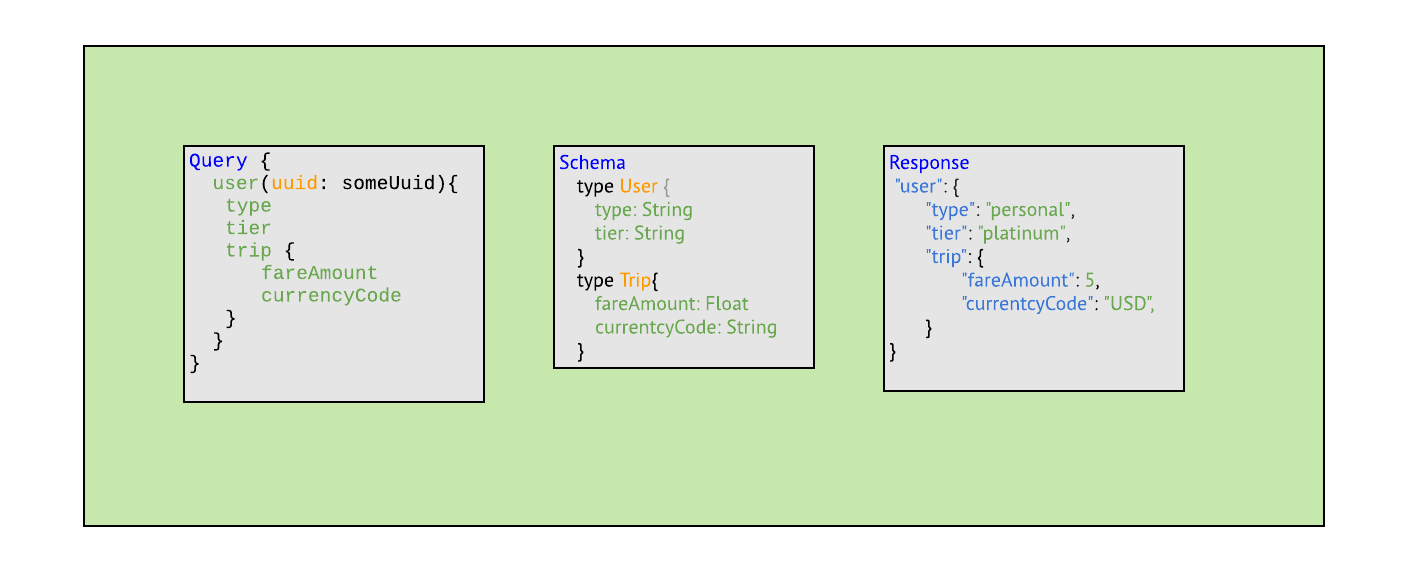
Once schemas and resolvers were in place, the GraphQL server could use them to resolve any queries it received. Now, when a caller queries a field, GraphQL calls a resolver to fetch the corresponding data for processing. After processing all the fields and nested fields (for example, the fareAmount and currencyCode, depicted in Figure 4, below)within the query, the GraphQL server returns a structured response to the client, similar to a JSON file.
Customer Care Platform architecture
Integrating GraphQL into our Customer Care Platform changed its architecture significantly from the previous CCS-based system. The new architecture, depicted in Figure 5, below, frees developers from continually writing new adapters and layers for each new upstream service. Rather than loading complete user data files, GraphQL’s declarative query-based data fetching calls the needed data quickly with limited strain on the overall system.

The Customer Care Platform’s architecture includes the following components:
- Fusion.js/Apollo: This web application receives query requests for various sets of data from our Customer Care Platform and passes them on to our GraphQL server.
- GraphQL server: The artery of this architecture, the server receives and processes queries initiated from the Customer Care Platform’s front end.
- Resolvers: After the GraphGL server interprets an incoming query and locates its corresponding schema, it invokes resolvers corresponding to the schema.
- Query context cache: GraphQL server checks this cache to see if data for the current request has already been cached within the query. If it has been cached, it will return the result to the client. Otherwise, it will batch the load then route it to the next step.
- Memory and Redis caches: Similar to the query context cache, we check the memory and Redis caches to see if we can return a result without making a call to fetch data from upstream services.
- RPC client: If the GraphQL server cannot find the data in a cache, an RPC client will be invoked to fetch the data from Uber’s microservices and return the result to the client.
- Nested resolvers: Some queries may query relationships across multiple services. Engineers continue to call resolvers based on the structure of the query. The system recursively repeats steps five through seven until the query calls all the necessary nested data.
Implementing GraphQL using Fusion.js
We used Fusion.js, Uber’s open source, universal web framework, to build the GraphQL server with our Customer Care Platform frontend. Due in part to our needs, the Uber Web Platform team developed fusion-plugin-apollo, fusion-apollo-universal-client, and fusion-plugin-apollo-server to host a web server and GraphQL endpoint.
After the server, the second most important part of the GraphQL implementation is our resolvers, which define how the platform fetches and renders data from upstream services. Atreyu, our in-house communications layer, helps our web applications interact with upstream services by providing a common interface that can make requests to many services at one time. We leveraged our in-house communication layer for the Customer Care Platform, using it to make requests to our service-oriented architecture APIs. The resolvers then perform simple conversions if needed and return the query results to the front-end client.
As Uber continues to grow, we add new business lines and new features to existing products. In these cases, we need to add new upstream services, all of which require new communication layer client set-up code. In alignment with our goal of making our engineering more efficient, our Customer Obsession team collaborated with the Web Platform team to build a code generation tool, which accomplishes three primary objectives:
- It generates Flow-typed communication layerRPC client code from Apache Thrift or gRPC service definitions.
- It registers new upstream services as new dependencies.
- It scaffolds schema and resolver files for each new service.
After running this code generation tool, engineers fill in the schemas and resolvers associated with the Customer Care Platform, specifying schemas based on the endpoint structure of the request and the specific fields we want to use. With our new architecture, engineers can easily implement resolvers using the auto-generated client code to call the specified endpoint without having to interface with the communication layer.
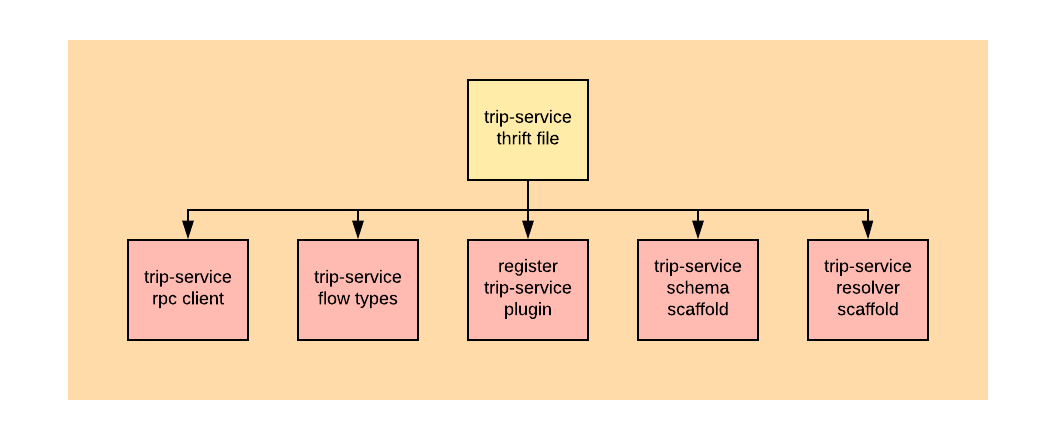
For example, when adding a new trip service, the code generation tool will read the Thrift file for upstream services and generate the RPC client, flow types, plug-in registration, schema scaffold, and resolver scaffold, as shown in Figure 6, below:
To make the Customer Care Platform even more comprehensive, back-end engineers on our Customer Obsession team have also begun building a data hydration gateway on top of GraphQL. When completed, this feature will help our Customer Obsession team hydrate customer ticket information without making unnecessarily repetitive calls to external services.
Monitoring system health
We implement Uber-specific logging and tracing in our generated RPC client in order to track our data and ensure accuracy. If there is a partial failure in the query resolution, the GraphQL API will still return a partial success response, and our RPC client will log the details of the error from the communication layer’s request to our service’s backend. The response includes fields such as headers, callers, request parameters, and error messages to help us identify any upstream errors. To understand how well the system is operating, we onboarded the Elastic Stack dashboard, which gathers, processes, and displays massive amounts of log data in near real time.
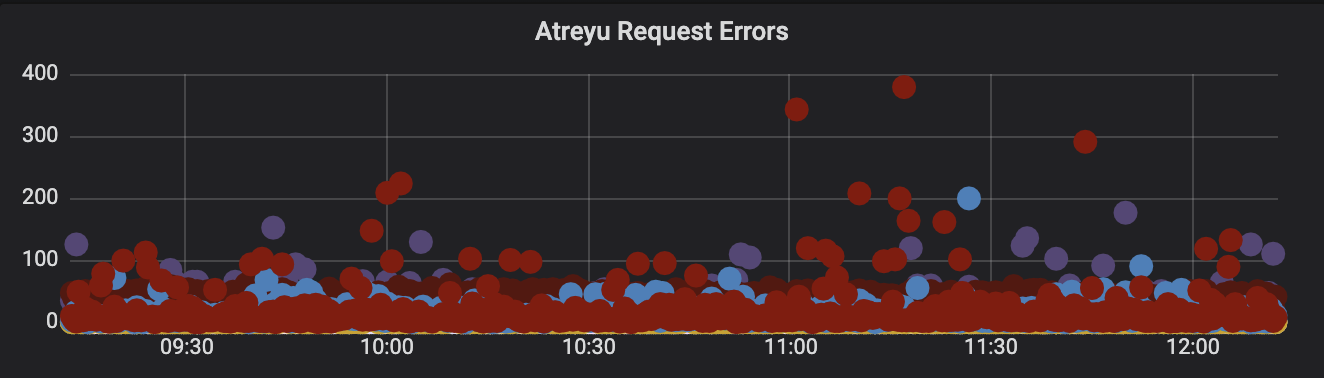
Our engineers have implemented monitoring at the endpoint and service levels of our Customer Care Platform. We log requests-per-second from the Customer Care Platform front end, the number of errors from each upstream endpoint, the success/error rate, and the 95th percentile (p95) performance. We tweak timeout configuration based on the p95 number we generate. We also use the Elastic Stack dashboard to determine the cause for errors. As we integrated GraphQL into our Customer Care Platform, we took the opportunity to clean up legacy code and align expectations with upstream services.
Our monitoring system also supports endpoint-level alerts. By templating alerts,, we utilize Uber’s configuration-based alerts generation command-line interface to monitor alerts and generate dashboards. This method improves endpoint contributor mapping. In addition, this system utilizes build automation that not only validates but also enforces that all alerts have been correctly set up to improve outage response.
Error handling
In addition to better tracking information, our new Customer Care Platform more easily identifies and amends data inaccuracies than our previous version of the solution. We improved its error handling processes by fixing server errors and request errors separately:
Server errors
We deal with upstream errors at the resolver level. After receiving the upstream error in the resolver, developers decide whether to simply throw an error back to the client, wrap the error with error code and more information, or return a nullable type without returning an error to the client.
Regarding request errors
When our Customer Care Platform sends a malformed request, the GraphQL server performs a pre-check and parses syntax errors before invoking the resolvers and schemas.
As a strongly typed language, GraphQL can handle validation errors on input. As implemented in our Customer Care Platform, GraphQL can enforce query validation on the frontend through a validation utility, such as validator.js.
Using different techniques to address different types of errors has streamlined this system and made mistakes easier to categorize and resolve.
A partial failure may occur when resolvers fan-out to multiple upstream services and some of the fields are not successfully fetched. While imperfect, this type of error can still return useful information to the initiating client. GraphQL includes a nullable concept, which means that if a server returns a null value for a field defined as non-nullable, GraphQL will return a null value to the nearest nullable parent. For example, Card is a nullable type that has a non-nullable field called cardNumber. If our query received a null value for cardNumber, the fact that cardNumber can’t be null would result in making its parent, Card, null. This nullable concept prevents the Customer Care Platform from publishing information without required fields, while still using the accurate data that may have come in with a partially failed request.
When using non-nullable fields, developers have to determine if the client prefers a partial result or no result at all. Nullable fields may be able to use incomplete data, while non-nullable fields would not. We apply non-nullable fields when:
- Arguments wouldn’t make sense if the field was not passed in. For example, a getFareAmount(tripUUID: ID!) field should never be called without the tripUUID argument, so it’s helpful to mark the tripUUID field non-nullable.
- We know certain object fields will always be populated. Defining these as non-nullable simplifies front-end code, which does not need to check for null values. For example, every single rider in our API has a last name and first name. Instead of writing code in the front end to validate that a last name and first name are returned by the query, defining these fields as non-nullable guarantees that those values will appear.
We distinguish between non-nullable and nullable concepts so that we can avoid causing informational issues while taking advantage of the partial data GraphQL’s nullable concepts can offer. This and other GraphQL features are applicable not only to the Customer Care Platform, but to other areas of Uber’s business, as well.
Extending GraphQL for all services
We’ve continued to use the new data hydration layer we built with GraphQL to efficiently hydrate data from upstream services for our Customer Care Platform frontend. We’ve leveraged this capability for back-end services on the platform as well.
Since our back-end services are written in Go and use thrift/protobuf, we couldn’t directly use GraphQL for them. Instead, we wrote a protocol wrapper proxy for GraphQL in Go.
With this proxy, we can write a GraphQL adapter once and use it everywhere. The data hydration layer is open for both front-end and back-end contributors. We perform maintenance on or modify the adapter just once and avoid having to duplicate our work across multiple services. We can also leverage GraphQL server features such caching, logging, tracing, alerts, and monitoring for all services within the Customer Care Platform.
Results
Since integrating GraphQL into our Customer Care Platform frontend last year, we’ve been sunsetting our old data hydration models. Our Customer Care Platform now offers streamlined fan-out, a much better developer experience, and improved error handling.
The feedback we have collected indicates that the developer experience has significantly improved in the following areas. Uber developers appreciate that, with GraphQL, they:
- Have to write less code: Removing multiple layers of middleware, moving adaption business logic to GraphQL consumers, and utilizing auto-generated, strongly-typed API clients has reduced the amount of code engineers need to write.
- Don’t have to worry about backward compatibility: GraphQL is a versionless API, so engineers don’t have to concern themselves with backward compatibility. Since GraphQL is versionless, it runs independent of clients, which has significantly reduced the number of rollbacks we have to perform.
- Enjoy schema flexibility: Engineers can define shared fields only once and query for different views using GraphQL schema stitching. This process combines multiple GraphQL schemas together and produces a merged schema that knows how to delegate parts of the query to the relevant sub-schemas.
- Rely on the system to handle errors gracefully: If resolvers fan out to multiple upstream services and cannot fetch certain fields, GraphQL handles these errors gracefully.
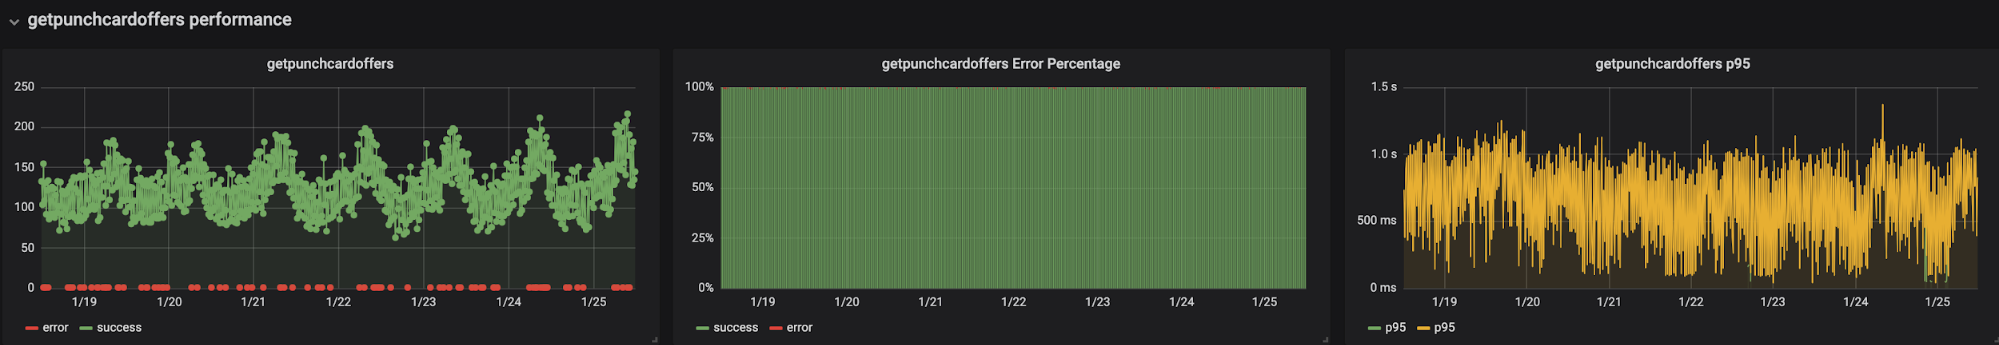
- Better understand and can address their systems’ performance: We’ve implemented Customer Care Platform-specific monitoring, tracing, and logging. We also created a performance dashboard for this exact purpose. In doing so, we developed a better understanding of key performance details, such as the highest rate of upstream errors, the most expensive upstream calls, and the most clogged caches. Having this performance data makes it easier to optimize these aspects of the platform. It is also now easier to clean up the solution’s legacy code and let upstream services take ownership of their endpoint-level errors.
Final considerations
Now that we’ve implemented GraphQL to enhance developer productivity, we’re examining ways to improve caching on our new Customer Care Platform. Our old data structure incorporated both memory and Redis caches by defining cache configurations for each service, achieving a 60 percent cache hit rate.
Implementing query context caching in the Customer Care Platform should achieve even more efficient cache use. We plan to add a query context cache through DataLoader, an open source data caching and batching utility available as part of the GraphQL stack. This cache should significantly increase our efficiency for Customer Care Platform use cases. Combined with GraphQL, DataLoader batches queries, reducing the number of calls to upstream services. Likewise, its caching function reduces the number of calls for the same data.
The Customer Care Platform’s front-end team is also exploring the possibility of sharing schema and resolver files with other teams at Uber. We are planning to expose our GraphQL solutions in the Customer Care Platform as a service under a web monorepo so that other front-end services at Uber can use its schemas and resolvers. Each front-end service would then host its own GraphQL server. In turn, each of these servers would have its own caching and authentication configurations.
GraphQL has shown promise in making customer support queries more efficient in the Customer Care Platform. Any additional improvements we make will further the goal of quickly fetching the information needed to effectively solve user issues.
Chintan Shah, an engineering manager, and ZJ Loh, a staff software engineer, both from Uber’s Customer Obsession team, contributed to this article.
If you are interested in building leading edge data infrastructure, consider joining our team!
Lead image by Dimitris Vetsikas from Pixabay.

Kunyao Liu
Kunyao Liu is a software engineer on Uber's Customer Obsession team.
Posted by Kunyao Liu
Related articles


How LedgerStore Supports Trillions of Indexes at Uber
April 4 / Global
Most popular
Model Excellence Scores: A Framework for Enhancing the Quality of Machine Learning Systems at Scale
The Easter Shop and Pay with Uber Eats Gift Card Sweepstakes Official Rules

UberX Priority FAQ

Uber Health and Findhelp support patients beyond the four walls of a medical office
Products
Company
