Uber’s Real-time Data Intelligence Platform At Scale: Improving Gairos Scalability/Reliability
January 19, 2021 / Global
Background
Real-time data (# of ride requests, # of drivers available, weather, game) enables operations teams to make informed decisions like surge pricing, maximum dispatch ETA calculating, and demand/supply forecasting about our services that improve user experiences on the Uber platform. While batched data can provide powerful insights by identifying medium-term and long-term trends, Uber services can combine streaming data with real-time processing to create actionable insights on a minute-by-minute basis.
We built Gairos, Uber’s real-time data processing, storage, and querying platform to facilitate streamlined and efficient data exploration at scale. It empowers teams to better understand and improve the efficiency of the Uber Marketplace through data intelligence. Use cases include surge pricing, maximum dispatch ETA calculating, and demand/supply forecasting.
To ensure that Gairos can continue to optimize its performance across an ever-expanding portfolio of use cases, we re-architectured the platform for greater scalability, stability and sustainability. Two of these optimization strategies with the greatest impact include data-driven sharding and query routing and intelligent caching.
Leveraging data-driven sharding and query routing, the platform can support four times the concurrent queries than our previous solutions. Some critical clusters have even stabilized from one outage per month to zero outages per month. Since launch in December 2018, the platform has been scaled over ten times with intelligent caching, with the cache hit rate reaching over 80 percent.
Why Gairos?
There are services that leverage real-time data in the Uber ecosystem. Each team maintains their own data pipelines and query service for their use cases. They have to keep the lights on (overseeing the monitoring, alerting, maintaining the streaming processing framework, etc. of their solutions) within their own teams instead of focusing on optimizing their systems. Gairos came into place to create a unified real-time data processing, storage, query platform so that these use cases can be onboarded. Users can focus on customizing the system’s business logic instead of more generic tasks for a real-time data system. Gairos fulfills the following purposes:
- It allows users to query data at a high level without worrying about all the low-level details of our data layer, such as potentially heterogeneous data sources, query optimizations, data processing logic, and indexing schemes.
- It allows Gairos team to experiment and evolve our data layer without impacting the consumers (via domain specific data abstraction layer).
- It will be optimized based on the use case to handle high throughput low latency calls or offline batch processing/modeling based calls.
Gairos Overview
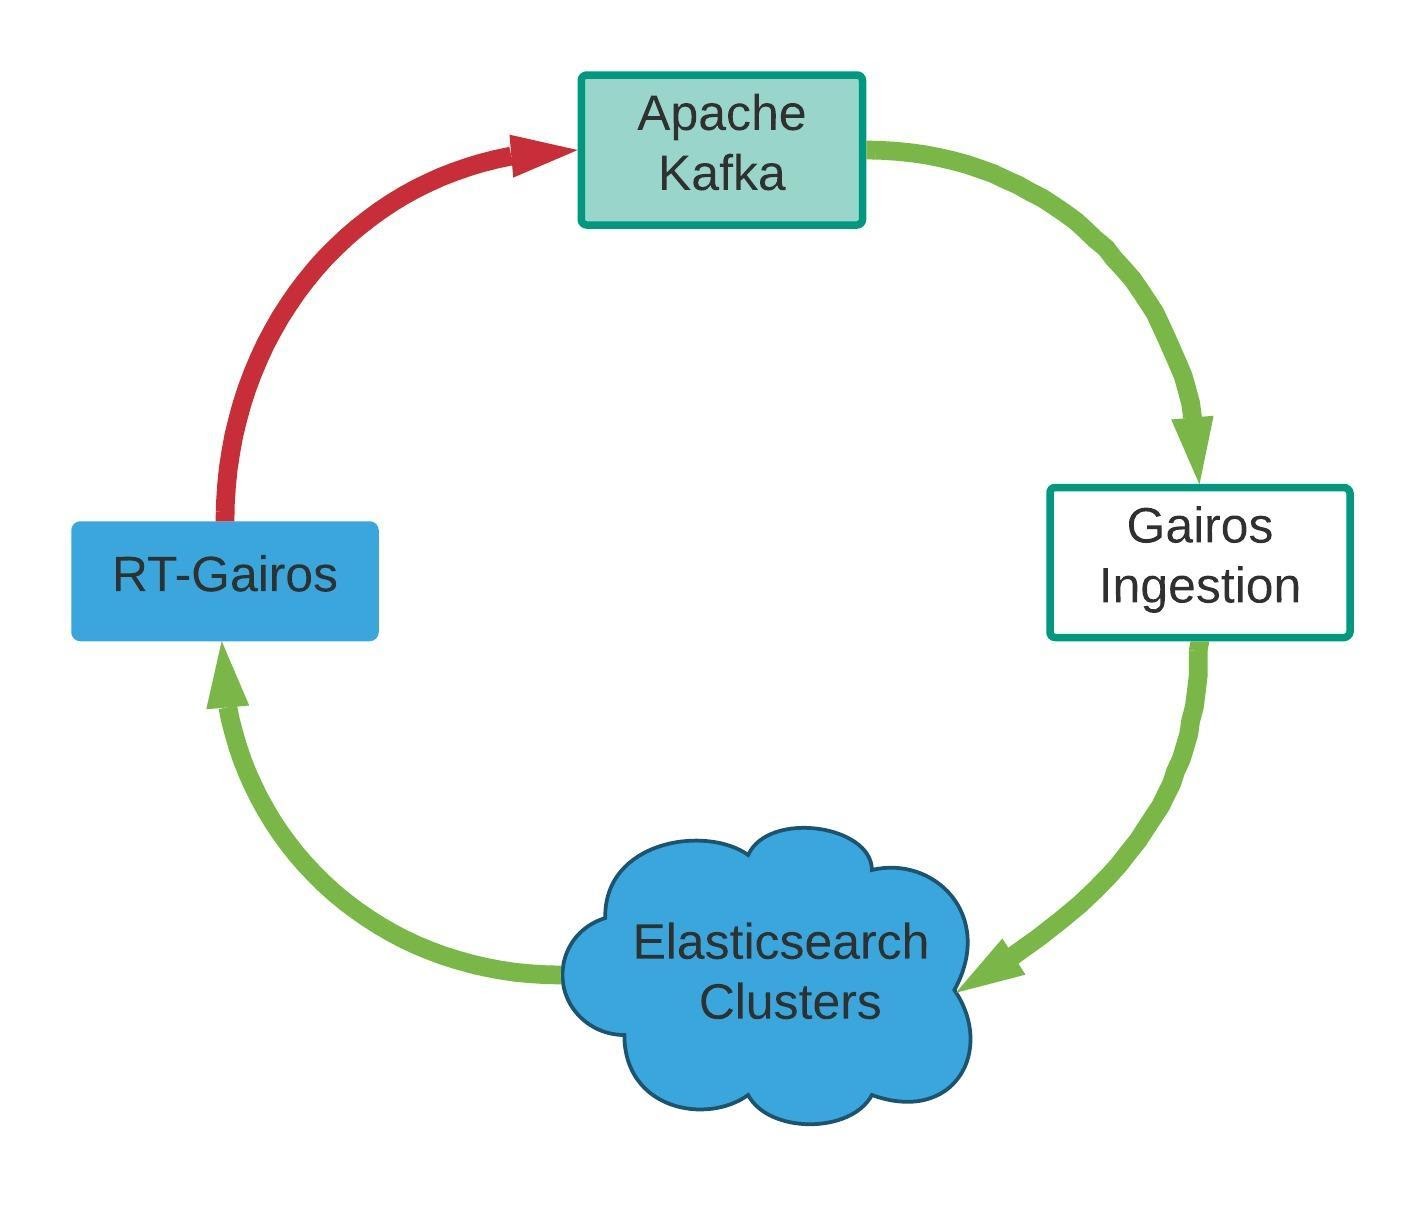
Gairos, depicted in Figure 1, below, ingests data from different Apache Kafka topics and writes data to different Elasticsearch clusters.
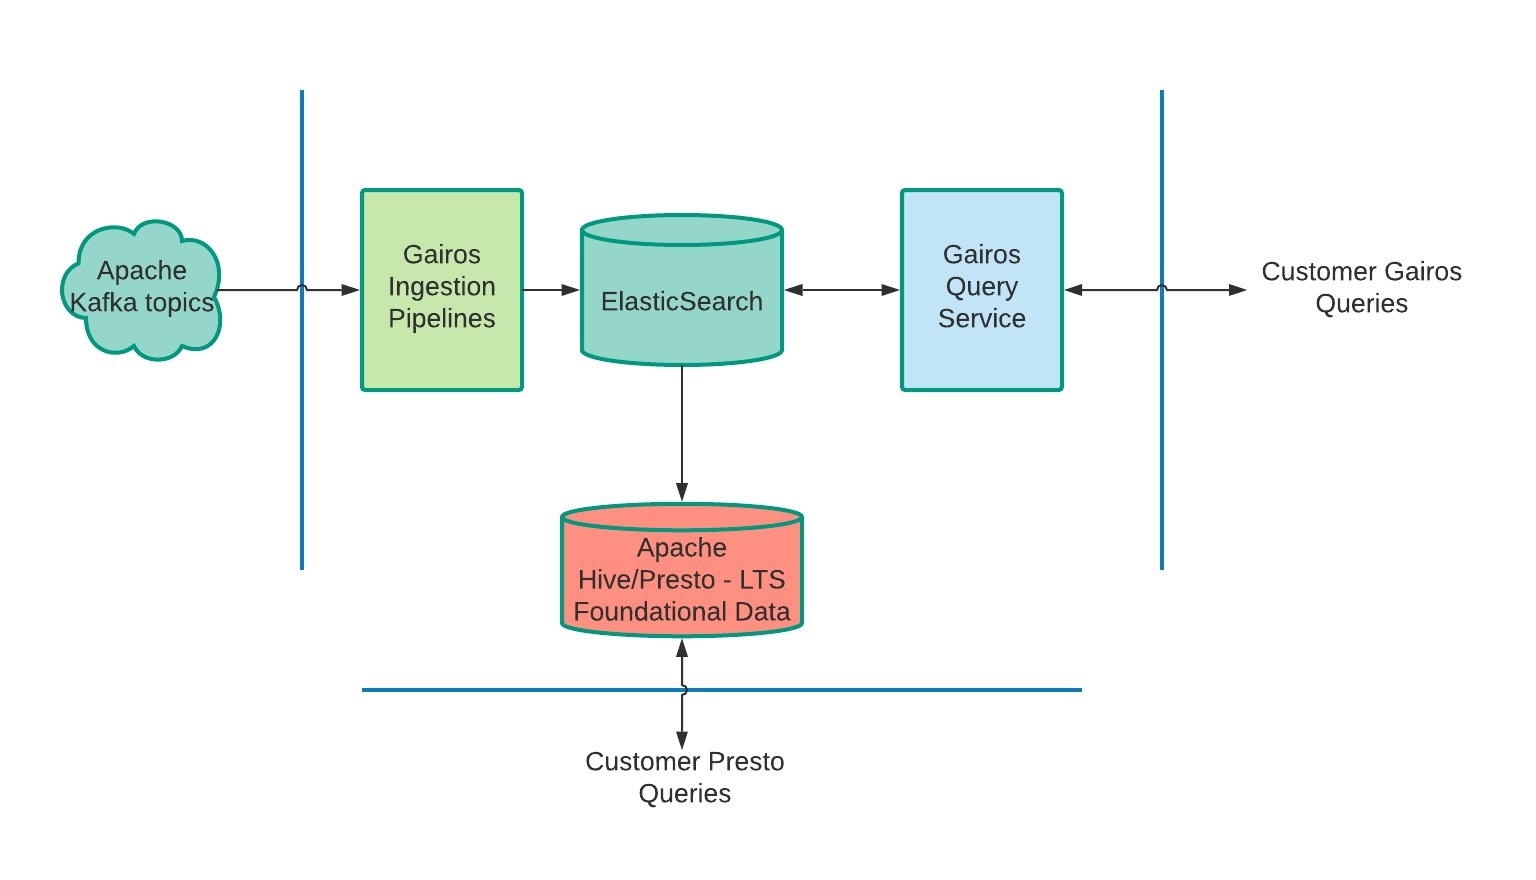
Gairos query service is a gateway to query data in these Elasticsearch clusters. Gairos clients send queries to Gairos query service to get data in real-time. Data is also persisted to HDFS for long-term analysis in Apache Hive and Presto.
A few systems are involved in Gairos: Apache Kafka, Gairos ingestion pipelines, Elasticsearch clusters, Gairos query service etc. If any one of them has a problem, some customers will be impacted and it will be a bad experience. As Uber’s Marketplace business continues to scale, the number of data pipelines for Gairos keeps increasing. More and more data sources need to be added to Gairos to support new business use cases.
Use Cases at Uber
We use Gairos for a wide variety of insights-collecting use cases at Uber, including:
- Dynamic pricing: Surge pricing service is reading demand and supply data based on hexagon to calculate surge multiplier at specific location and time.
- Driver Movement uses real time demand and supply data to generate driver surge and carbon suggestions for drivers.
We refer to the data underlying each trip as a session, which begins when a user opens the Uber app. That action triggers a string of data events, from when the driver actually accepts a ride to the point where the trip has been completed. Given the complexity and scale of our systems, this data is distributed over multiple disparate event streams.
For example, when a driver opens the Uber app, it fires off an event on the driver event stream. The app displays offered trips (uberPOOL, uberX, UberBLACK, etc.) available in that geographic region along with prices for each, as generated by our surge pricing system, with each price appearing as a discrete event on the impression event stream. When that driver accepts a trip, the request goes to our dispatch system, which matches the rider with a driver-partner and assigns his vehicle to that trip. When the driver-partner picks up the rider, his app sends a ‘pickup completed’ event to the dispatch system, effectively starting the trip. When the driver reaches his destination and indicates that the passenger has been dropped off in their app, it sends a ‘trip completed’ event.
A typical trip lifecycle like this might span across six distinct event streams, with events generated by the rider app, driver app, and Uber’s back-end dispatch server. These distinct event streams thread into a single Uber trip.
It is challenging to process these different streams and query them in real-time so that our services can take action based on data insights quickly.
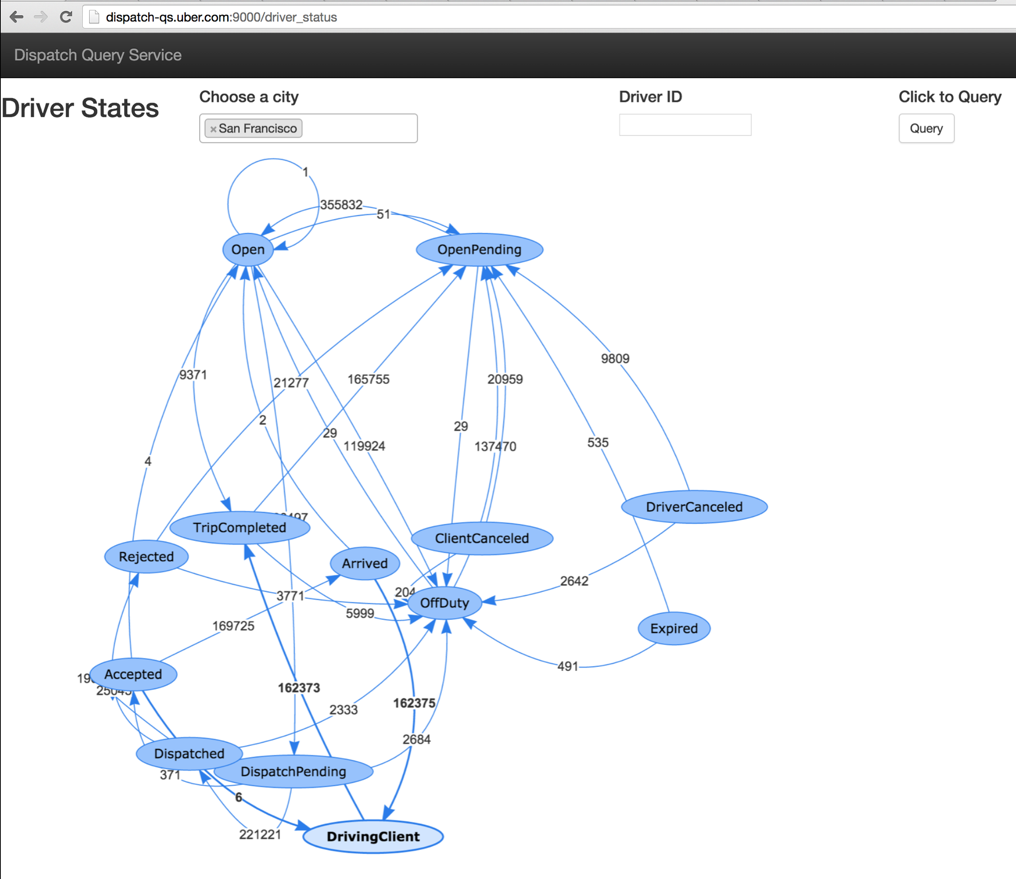
Driver state transitions for drivers
The following graph (Figure 2) shows the aggregated state transitions of drivers in SF in a user-defined time window. It is the result of a single query returned within a second.
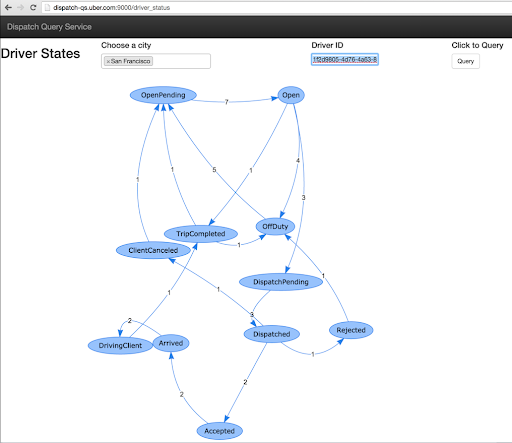
State transitions of a single driver
The following graph (Figure 3) showed all the state transitions of a single driver in SF in a user-defined time window. The query is identical to the previous one except that it has one more filter that matches a given driver UUID.
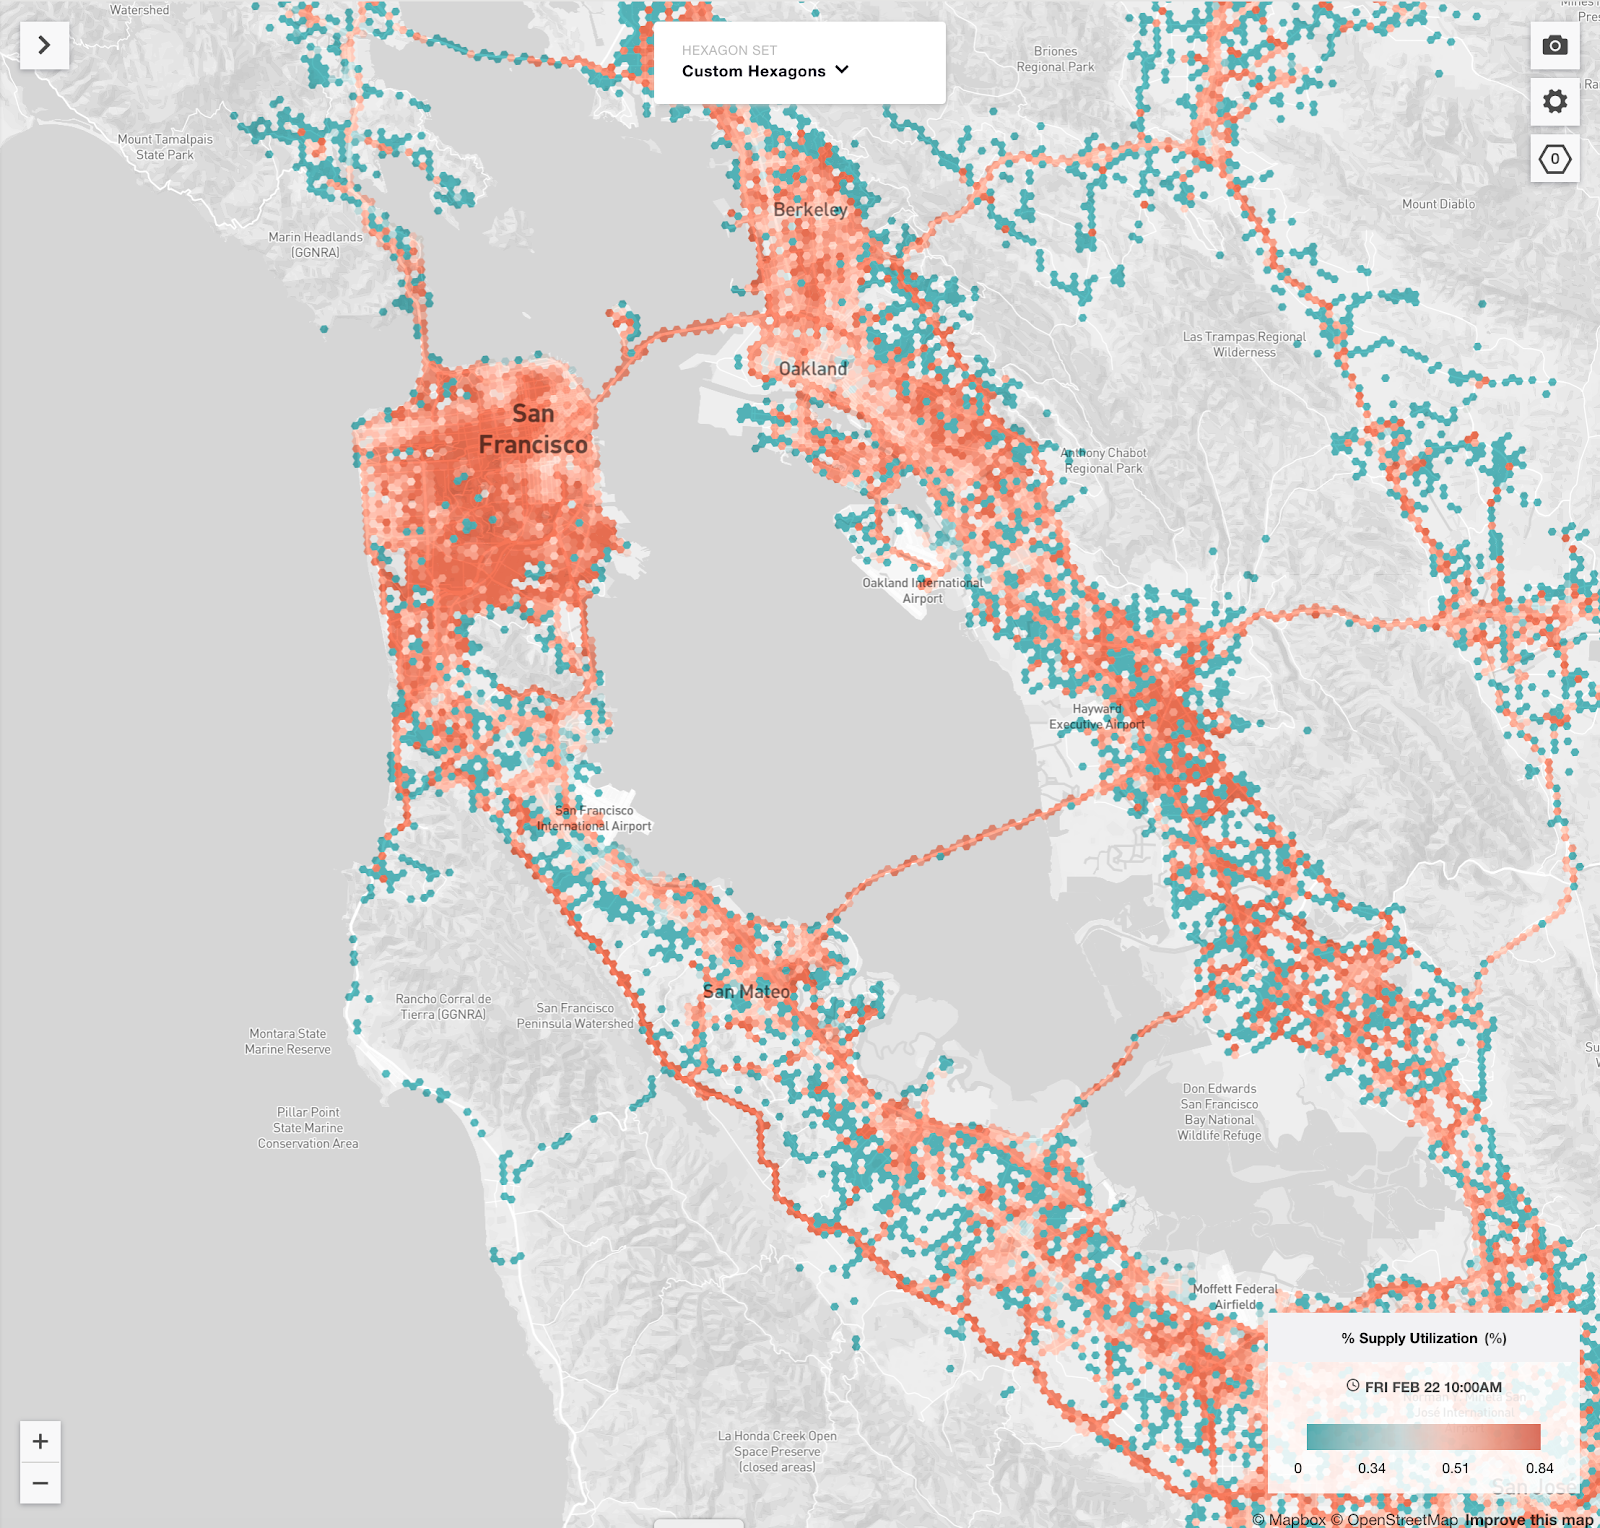
Driver utilizations grouped by geo locations
The following graph (Figure 4) shows driver utilizations by geo locations.
Last but not least, let’s see how surge pricing works with data from Gairos.
There are times when so many people are requesting rides that there aren’t enough cars on the road to help take them all. Bad weather, rush hour, and special events, for instance, may cause unusually large numbers of people to want to ride Uber all at the same time. In these cases of very high demand, fares may increase to help ensure those who need a ride can get one. This system is called surge pricing.
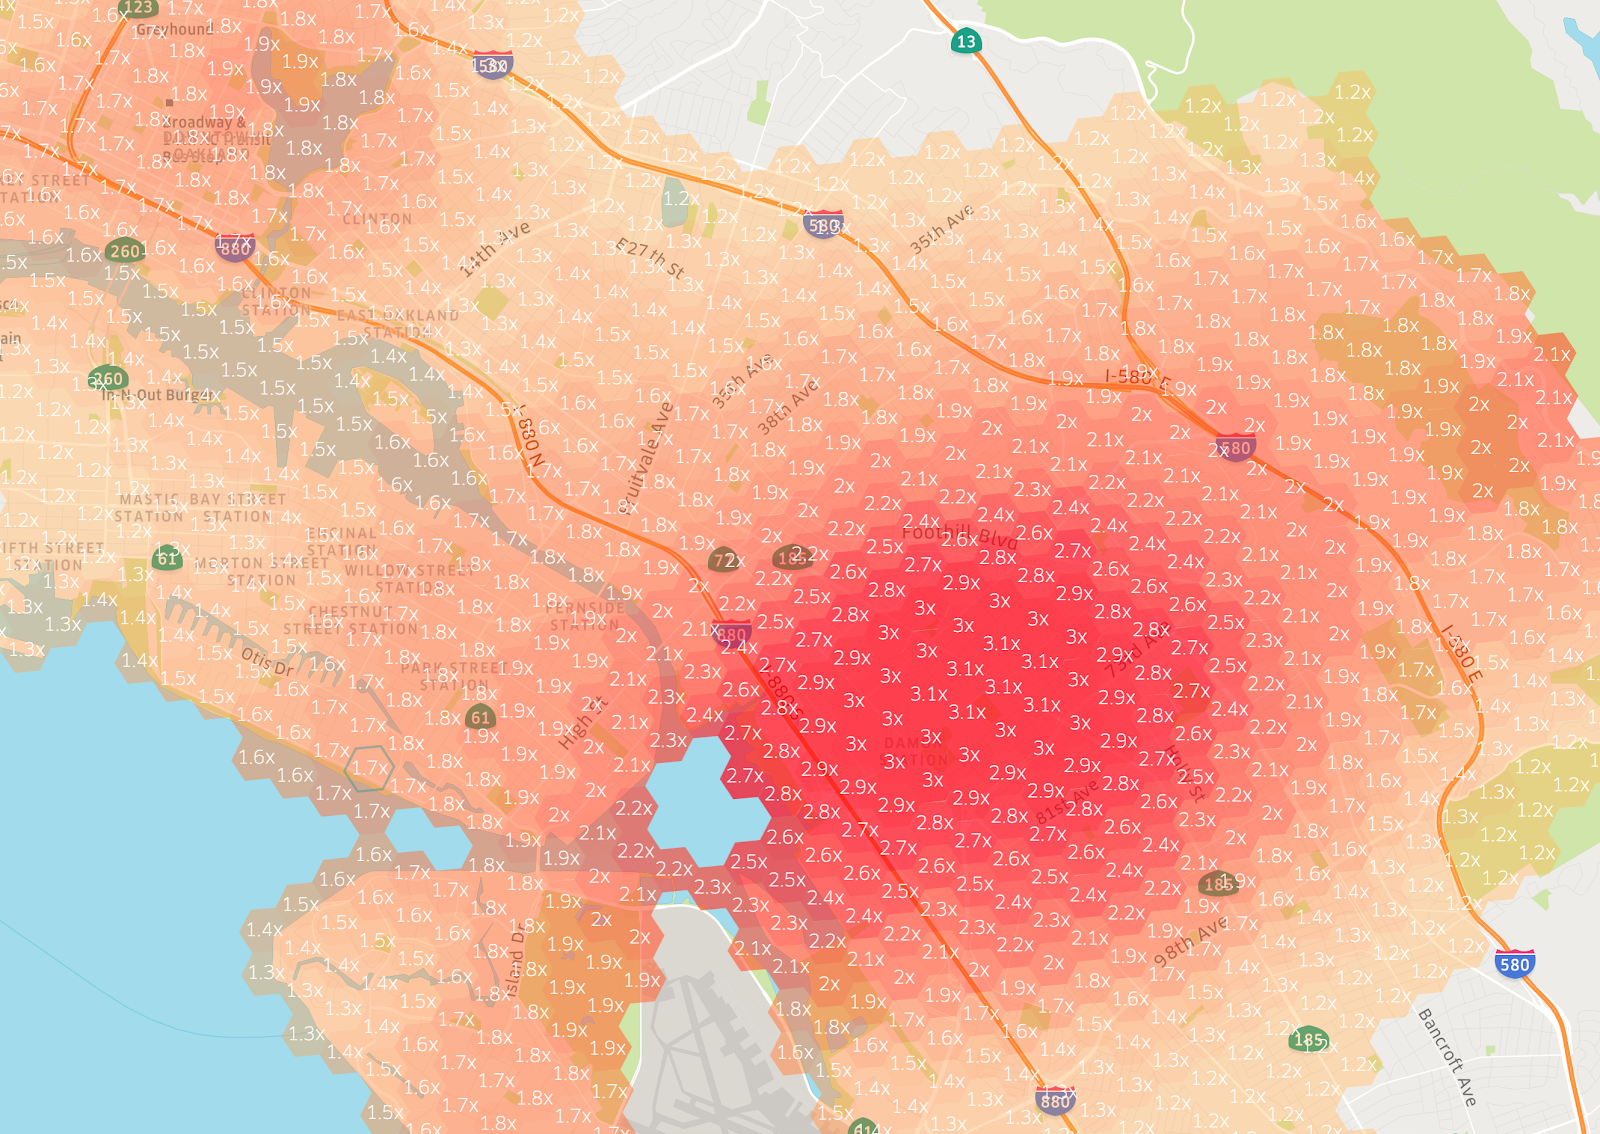
To calculate the surge multiplier for a hexagon defined by H3, the number of requests (demand) and the number of available drivers (supply) will be queried from Gairos to get the latest data. These data will be input to the pricing model and the pricing model will generate a surge multiplier for that location. Figure 5 shows surge multipliers in different hexagons around the stadium in Oakland when there was a game.
Challenges in Scalability/Reliability
Our first implementation of Gairos came with several technical challenges and unforeseen issues.
As the use cases leveraging Gairos increased, so too did the amount of real-time data flowing through the system. For context, the total size of queryable data served by Gairos is 1,500+TB and the number of production pipelines is over 30. The total number of records is more than 4.5 trillion and the total number of clusters is over 20. Over 1 million events flow into Gairos every second. It is increasingly important to make the system more stable, scalable, and sustainable to power an increasing number of use cases.
Below, we highlight some technical challenges that surfaced once we began to scale Gairos:
- Multiple use cases sharing the same cluster can cause the cluster to become unstable. Some dramatic change in one use case may affect all other use cases in that cluster. For example, if the input data volume doubles for one use case, it may affect the data availability for other use cases.
- Ingestion pipeline lagging. It is a generic challenge for all real-time pipelines. SLA (service level agreement) is usually very tight from a couple of seconds to a few minutes. If any component in the pipeline slows down, it may cause some lagging and SLA misses.
- Query performance degrades due to traffic spikes from some clients. Since it is a multi-tenant system, some sudden traffic spikes may affect some queries running in the same cluster.
- Some data sources are not used anymore. Once a use case is onboarded to Gairos, there is no automatic way to check usage for these use cases. If the data is not used any more, it will be better to free up resources for other use cases.
- Some heavy query causes the whole Elasticsearch cluster to slow down.
- ES cluster master node down. It could be due to various reasons: the network is not stable, the size of metadata is too big to manage, etc.
- CPU load for some nodes is high. These nodes are having hotspot issues, in other words, they are handling more shards or more read/write traffic than our resources (CPU/Memory/Network) can reasonably handle.
- Some nodes crash. It could be due to disk failures or other hardware failures.
- Some shards lost. If multiple nodes are done at the same time and a shard is only available in these nodes. We may lose data in that shard.
Our on-call engineers get paged very often and the cost to maintain these pipelines and systems is high.
The main problem, however, with our first iteration of Gairos was that how Gairos data is used did not loop back to Gairos to guide the optimization and continuously improve the system. Gairos does not proactively check whether the data is used as specified and can not adjust to the changes (traffic pattern change, query pattern change etc.). In Gairos self-optimization project, we closed the loop (Figure 6) and let user queries drive the optimizations to make Gairos more stable, scalable, and sustainable.
To make the Gairos platform more stable and scalable across different use cases and to reduce maintenance costs, we had to make the system more efficient and intelligent.
Gairos Optimization Architecture
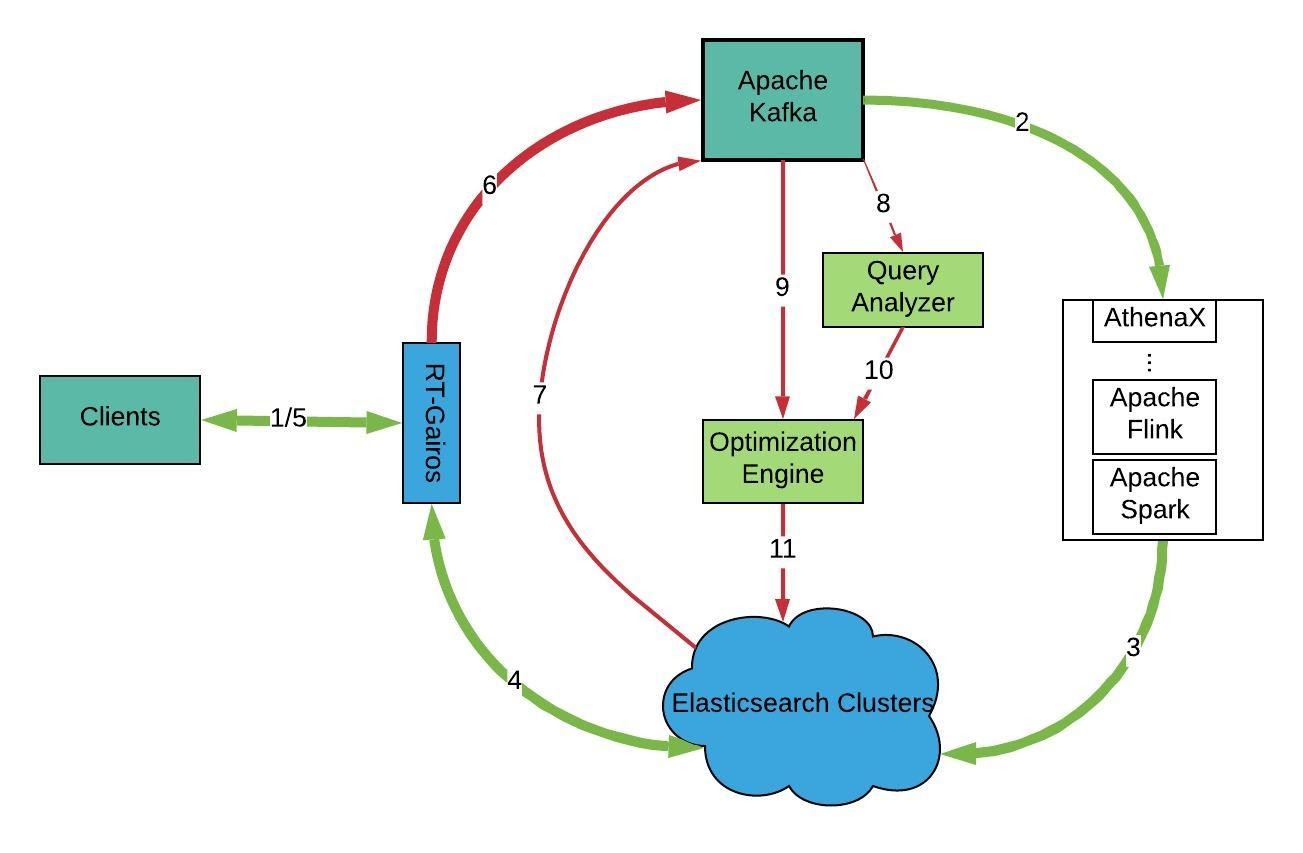
The revised high-level architecture is shown in Figure 7, above. The system’s major components are listed below:
- Clients: Gairos clients could be a service, a dashboard, a data analyst etc.
- Apache Kafka: We use Apache Kafka as a message queue system for events in services, RT-Gairos queries and Gairos platform metrics and events.
- Gairos-Ingestion: The Gairos-Ingestion component ingests data from different data sources and publishes events to Gairos.
- Elasticsearch Clusters: These clusters store output data from Gairos-Ingestion pipelines.
- RT-Gairos (Real-time-Gairos): RT-Gairos is the Gairos query service. It serves as a gateway to all Elasticsearch clusters.
- Query Analyzer: Gairos Query Analyzer analyzes queries collected from RT-Gairos and provides some insights for our optimization engine.
- Optimization Engine: The Gairos Optimization Engine optimizes Gairos’ ingestion pipelines, Elasticsearch cluster/index settings, and RT-Gairos, based on query insights and system statistics. For example, what is the minimal number of containers to use for an ingestion pipeline so that it can meet SLA 99 percent of the time? How many shards to use so that it can handle write/read traffic?
Below, we go into detail about what each of these components are responsible for in the overall Gairos ecosystem.
Clients
Clients can be services or non-service users like data analysts.
Service clients include all real-time services that depend on Gairos to serve user requests, including our dynamic pricing and trip forecasting services. These services send some events to Apache Kafka for downstream services and pipelines to process. When serving a request, they may query some data from Gairos to make a decision. For example, a forecast service may need to query to improve forecasts to predict driver-partner demand and supply during high-traffic events, or our dynamic pricing service may leverage Gairos to decide a surge multiplier based on demand, supply, and some forecast inputs.
Apache Kafka
Apache Kafka is a distributed streaming platform that lets clients publish/subscribe to a stream of events. All real-time services can send some important events to it for downstream services/pipelines to consume. It is also used by RT-Gairos to collect all queries run in Gairos.
Gairos-Ingestion (Processing Layer)
Gairos-ingestion is an ingestion framework to process data from different data sources and publish them to Gairos. Apache Spark streaming is used for some data sources.
Elasticsearch (Gairos Storage Layer)
Elasticsearch, the Gairos storage layer, indexes data from over 30 different data sources used by Gairos-Ingestion and readies it for Gairos clients to query.
RT-Gairos (Query Layer)
RT-Gairos serves as a gateway to Gairos. All queries go through it before reaching the Gairos storage layer. Real-time Gairos enforces access control, provides routing, and caches some query results. RT-Gairos will collect all queries to Gairos and push them to an Apache Kafka topic.
Query Analyzer
Query Analyzer analyzes queries gathered from RT-Gairos and generates insights to provide inputs to the Gairos Optimization Engine. As a start, simple techniques (filtered metrics, aggregations, time range, shard number, number of indices) are leveraged to generate some query patterns.
Optimization Engine
Based on system statistics and query insights obtained from Query Analyzer, Gairos Optimization Engine will use its lifetime knowledgebase to recommend some optimizations. It will update the settings of Gairos: Ingestion pipelines, RT-Gairos, and Elasticsearch.
Some setting changes may need benchmarking tests to see whether KPIs will improve or not before applying the given changes. For example, what is the best number of shards for a given data source? That is where an index benchmarking service comes into place.
Index Benchmarking Service
To do optimizations for settings with Gairos, we needed to incorporate a benchmarking tool to compare different settings based on defined KPIs (read/write throughput, latency, memory usage etc.).
Figure 8, below, we outline the different components of Gairos benchmarking service:

These components include:
- Elasticsearch Production Clusters: Elasticsearch Production clusters contain production data that will be copied to staging for load test. Production indices may be used as the baseline for benchmarking.
- Elasticsearch Staging Clusters: These clusters are used to store test data, in other words, randomly generated data or production data for experimentation purposes.
- Benchmarking Service: The Benchmarking Service accepts different settings for an index and carries out benchmarking tests against indices with different settings. Test results are available for other services to consume once tests are done.
- Load Test Tool: Given a large number of read/write requests, this tool can simulate different numbers of read/write QPS (Query Per Second) and record KPIs. Reads will be queries gathered from RT-Gairos in production. Writes will be simulated from related Apache Kafka topics used in production or publish topics directly.
The Gairos Benchmarking Service will accept requests from the Gairos Optimization Engine and carry out benchmarking tests. The benchmarking service replicates a single index instead of the whole history from production to staging, improving performance and reducing resource usage. If the performance for a single index is improved, the overall performance for that data source is improved because queries against different indices are executed independently. The optimization engine can decide whether to change index settings in production after assessing the test results.
As depicted in Figure 7, there are quite a few steps involved in the overall system. These steps include:
- Gairos clients send requests to RT-Gairos to get data.
- Gairos-ingestion ingests data from Apache Kafka topics and publishes to Elasticsearch clusters.
- Gairos indexes the data and makes it ready for query.
- RT-Gairos translates the query to an Elasticsearch query and queries Elasticsearch clusters for data.
- RT-Gairos sends the data back to clients.
- RT-Gairos sends the query information to Apache Kafka topic.
- Sample Elasticsearch cluster data regularly and sends the information to an Apache Kafka topic.
- Query Analyzer pulls query info from query Apache Kafka topic for analysis.
- Optimization Engine pulls Gairos platform statistics from Apache Kafka topic for analysis.
- Optimization Engine pulls Gairos query insights from Query analyzer to see whether anything should be done.
- Optimization Engine pushes the optimization plan to different components in Gairos platform.
Optimization Strategies
We apply a few optimization strategies which other organizations can use to optimize their real-time intelligence platforms too.
- Sharding & query routing
- Caching based on query pattern & signature
- Merge index
- Handling heavy queries
- Indexing template optimization
- Shard # optimization
- Bound index range
- Purge unused data
They will be elaborated one by one.
Sharding & Query Routing
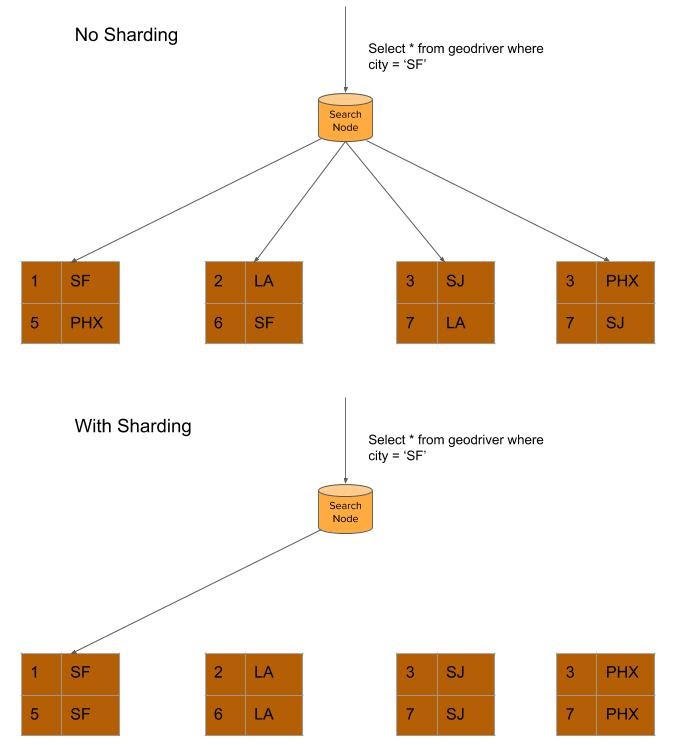
Sharding is partitioning data by some key so that data with the same key will be put in one shard. When writing to Elasticsearch indices, the key must be provided to put the doc in the correct shard. When querying the data, the query can be sent to a specific shard instead of sending to all shards if the key is specified in the query. This reduction in the number of nodes needed for a query can improve latency, and improve resiliency (if a single node is down but not needed by the query, it doesn’t matter).
Suppose we want to send a promotion offer to all drivers in SF and we need to get the list of drivers. In Figure 9, below, we are querying all drivers in SF. In the top, the data is not sharded based on city and the query has to run in all four shards to check whether any drivers are available. In the bottom, the data is sharded based on the city. The query can just retrieve data from the shard containing drivers in SF. It can be seen that the number of queries run reduces from 4 to 1.
A common problem for sharding is the hotspot issue (some shard needs to handle much higher write/query traffic than other shards). For example, if we distribute aggregated, anonymized driver-partner data by city ID, some cities (including San Francisco) are vastly larger than smaller cities, causing specific shards or nodes to be overburdened. It is important to keep the size and utility of shards roughly equal to help with allocation decisions and load distribution.
Below we outline the factors that need to be considered when sharding:
- Write QPS: This factor entails that the shard should be able to handle the peak traffic.
- Read QPS: This factor entails that the shard should be able to handle peak queries.
- Filters: Top x frequent filters used in queries. Top filters can be considered as possible sharding key candidates. The filter must have a large enough number of distinct values.
- SLA: Whether for analytic use cases or real-time use cases.
- Shard Size: We recommend keeping the shard size to 60GB or below.
The number of shards will be calculated based on write/read QPS and shard size. The following is the procedure to find the sharding key (Figure 10). Once the sharding key is determined, we use historical data to check whether shard distribution is within Gairos’ given threshold.
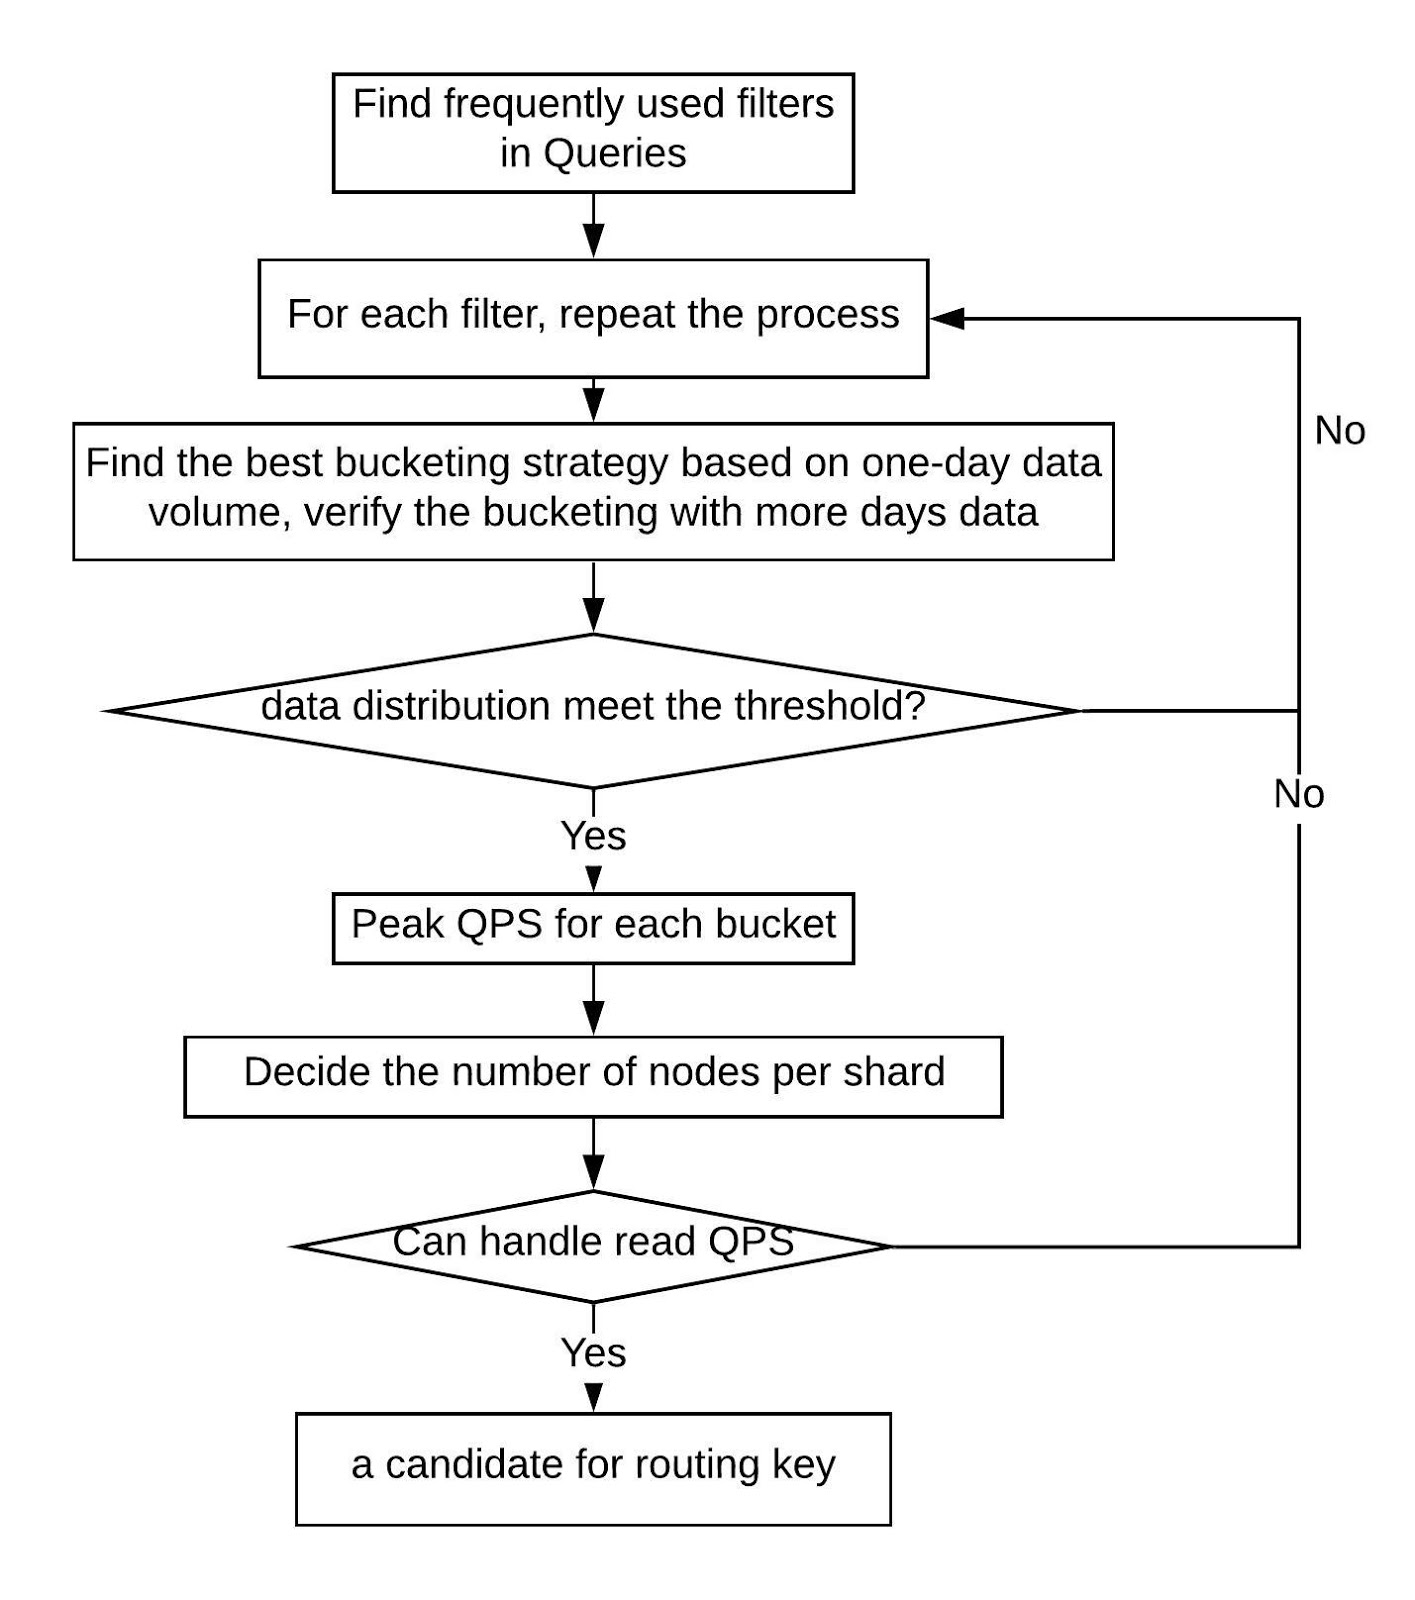
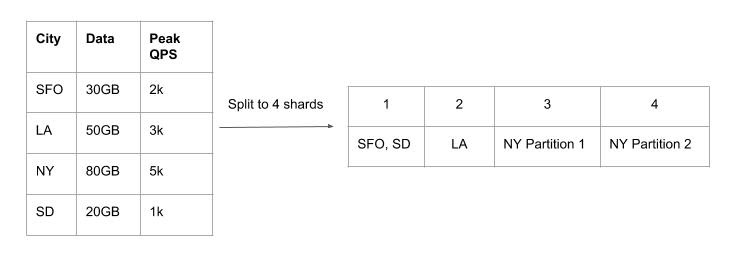
We check a simplified example for sharding in Figure 11, below. For this example, it is assumed that each node can handle 3,000 write QPS and can store at most 60GB data. Only data size and peak write QPS are considered.
Sharding must meet these constraints:
- Peak write QPS for each shard <= 3,000QPS
- Data size for each shard <= 60GB
The goal is to distribute data as evenly as possible to these shards.
Based on data size for each city, we can estimate the number of shards:
Shard # based on data size (30GB + 50GB + 80GB + 20GB)/60GB = 3
Based on peak QPS, we can get another estimate for the number of shards:
Shard # based on peak QPS (2k + 3k + 5k + 1k)/3k = 4
Get the maximal value of these two estimates:
Shard # max(3, 4) = 4
These four cities will be put in four shards. SFO and SD can be put in the same shard. LA can be in one shard. NY can be split into two shards. This way data is distributed more evenly across different shards while each node can hold the data and handle peak QPS.
For queries for drivers at SFO, they can be directed to shard 1 directly. While for queries for drivers at NY, they need to be directed to both shard 3 and 4.
To mitigate the skewed shard and hotspot problem, we developed a custom sharding algorithm for Gairos. In Figure 12, below, we list the the max/min # of docs per shard for the default sharding (Before) and our sharding algorithm (After).
| Max # of docs per shard | Min # of docs per shard | Max/Min | |
| Before | 47 million | 17 million | 2.76x |
| After | 30 million | 23 million | 1.3x |
Figure 12: Our sharding algorithm generates shards with smaller difference in terms of doc numbers and documents are distributed more evenly across shards.
It can be seen that docs are distributed more evenly among these shards. For Gairos’ default sharding algorithm, the max to min # of docs per shard ratio is 2.76 while it is 1.3 for our custom sharding algorithm.
Some benchmarking tests are carried out to check the latency and concurrent users they can support. Here are the results for the demand data source.
Figure 13 shows the latency under different numbers of clients. It can be seen the latency for data with sharding is lower than without sharding. The difference becomes larger as the number of clients increases.
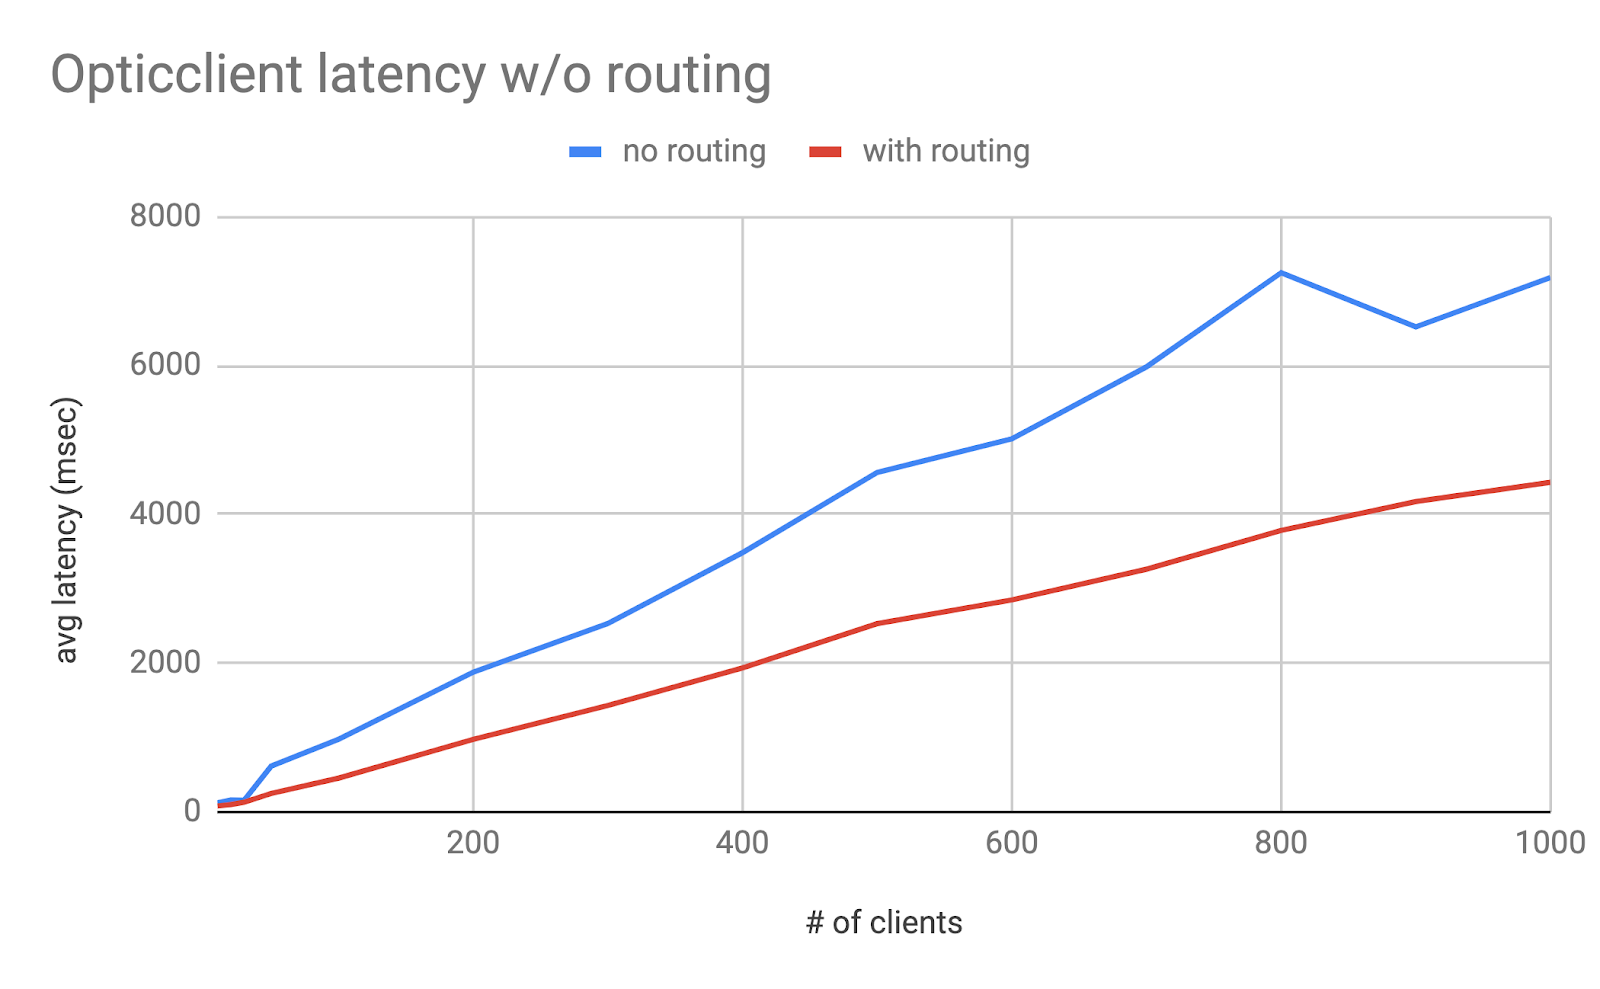
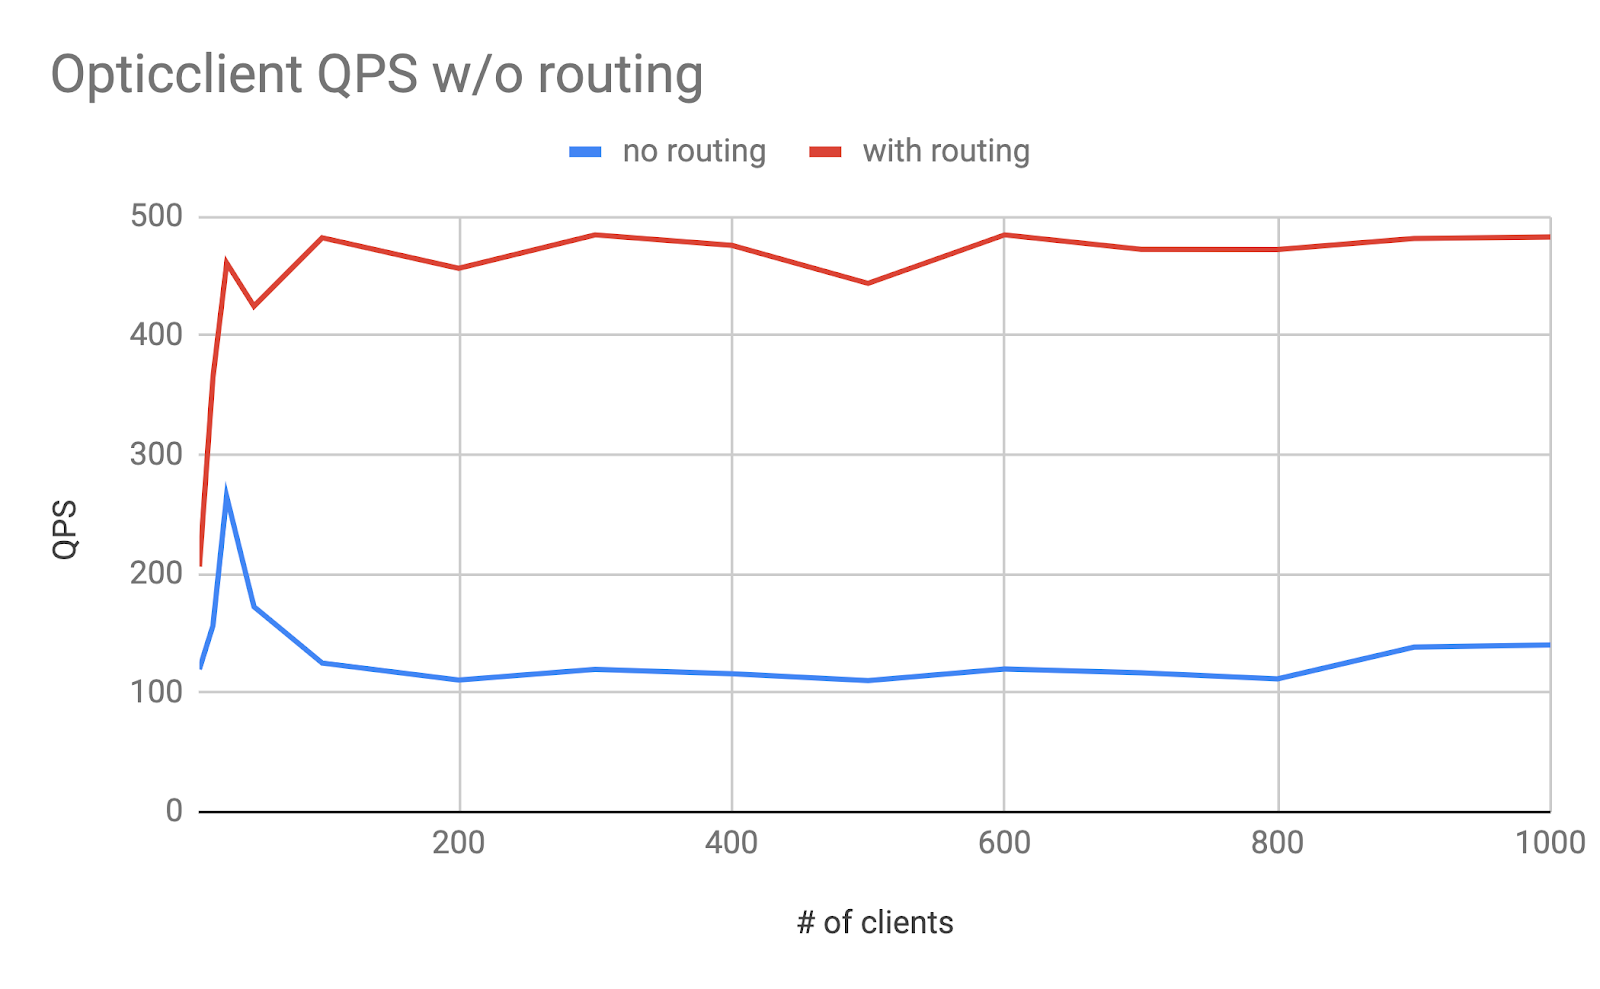
Figure 14 shows the number of concurrent users it can support under different numbers of clients. It can be seen that the number of highest QPS for with sharding is about 4x of highest QPS without sharding.
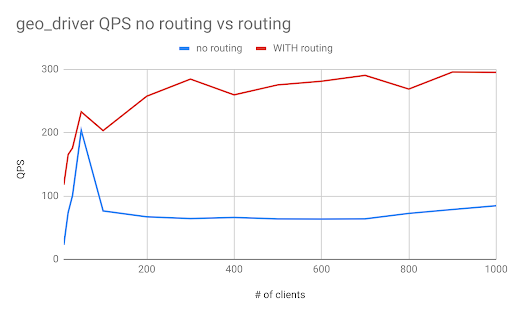
Below we share some optimization results for the second data source supply_geodriver. The number of documents is higher and the size of data is larger compared to demand data source (storing rider requests).
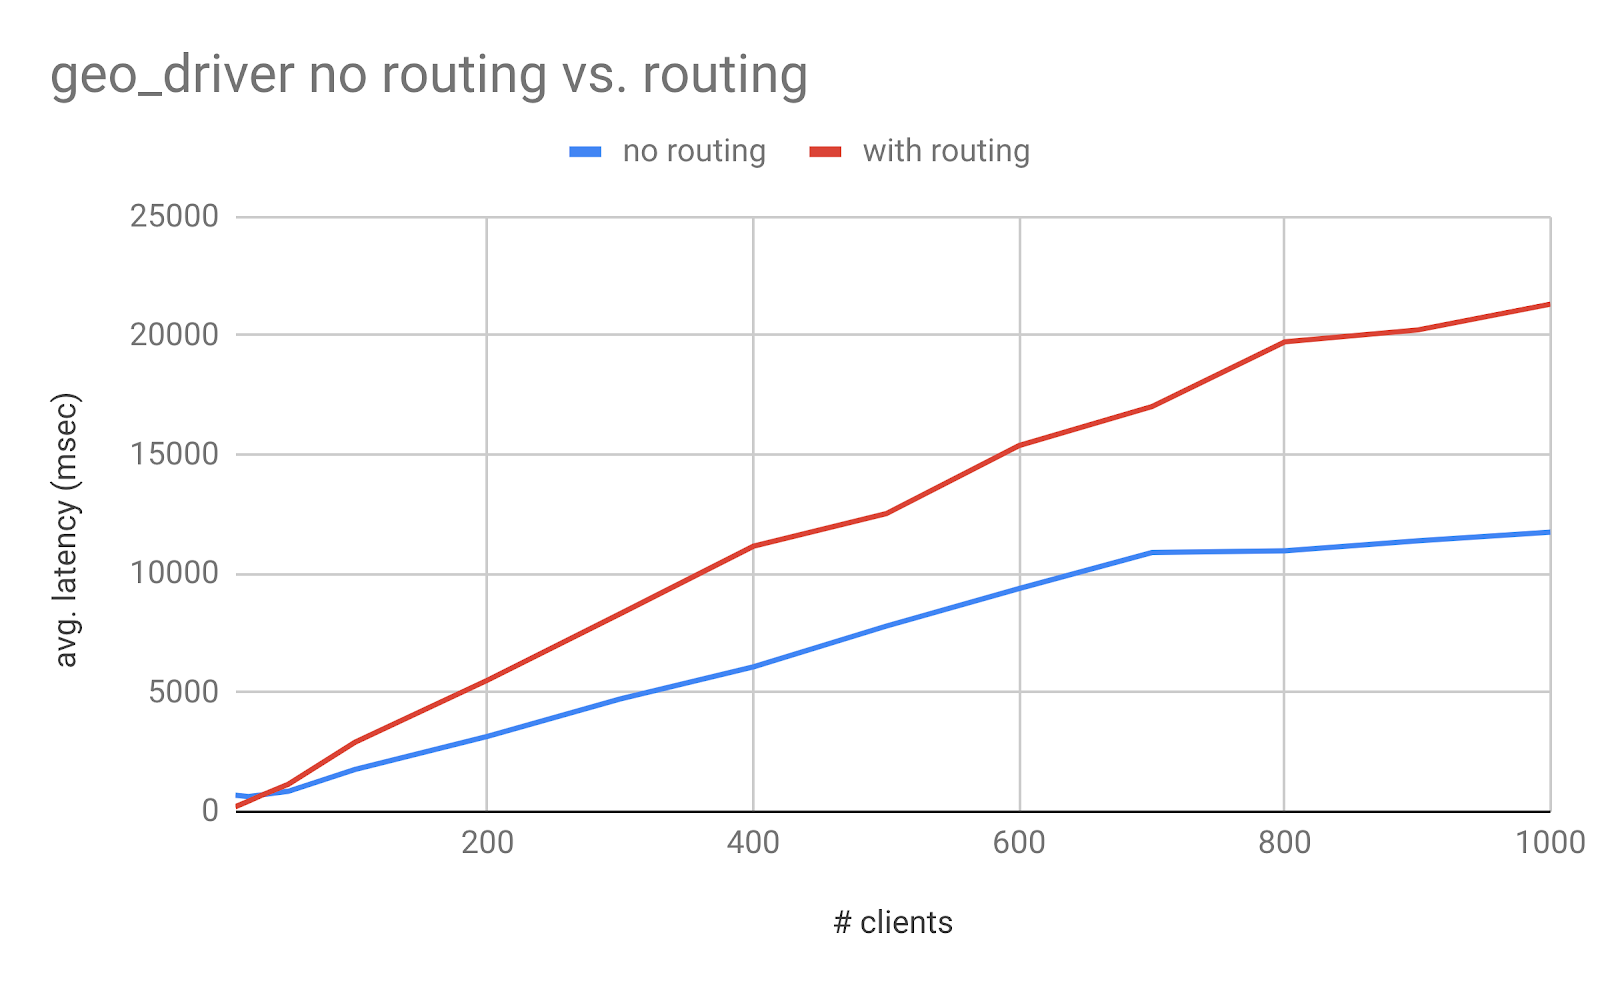
It can be seen from Figure 15 that the average latency is worse after sharding is used. For # of concurrent users it can support, it is 4x of that without sharding, as depicted in Figure 16, below:
The third data source is supply_status.
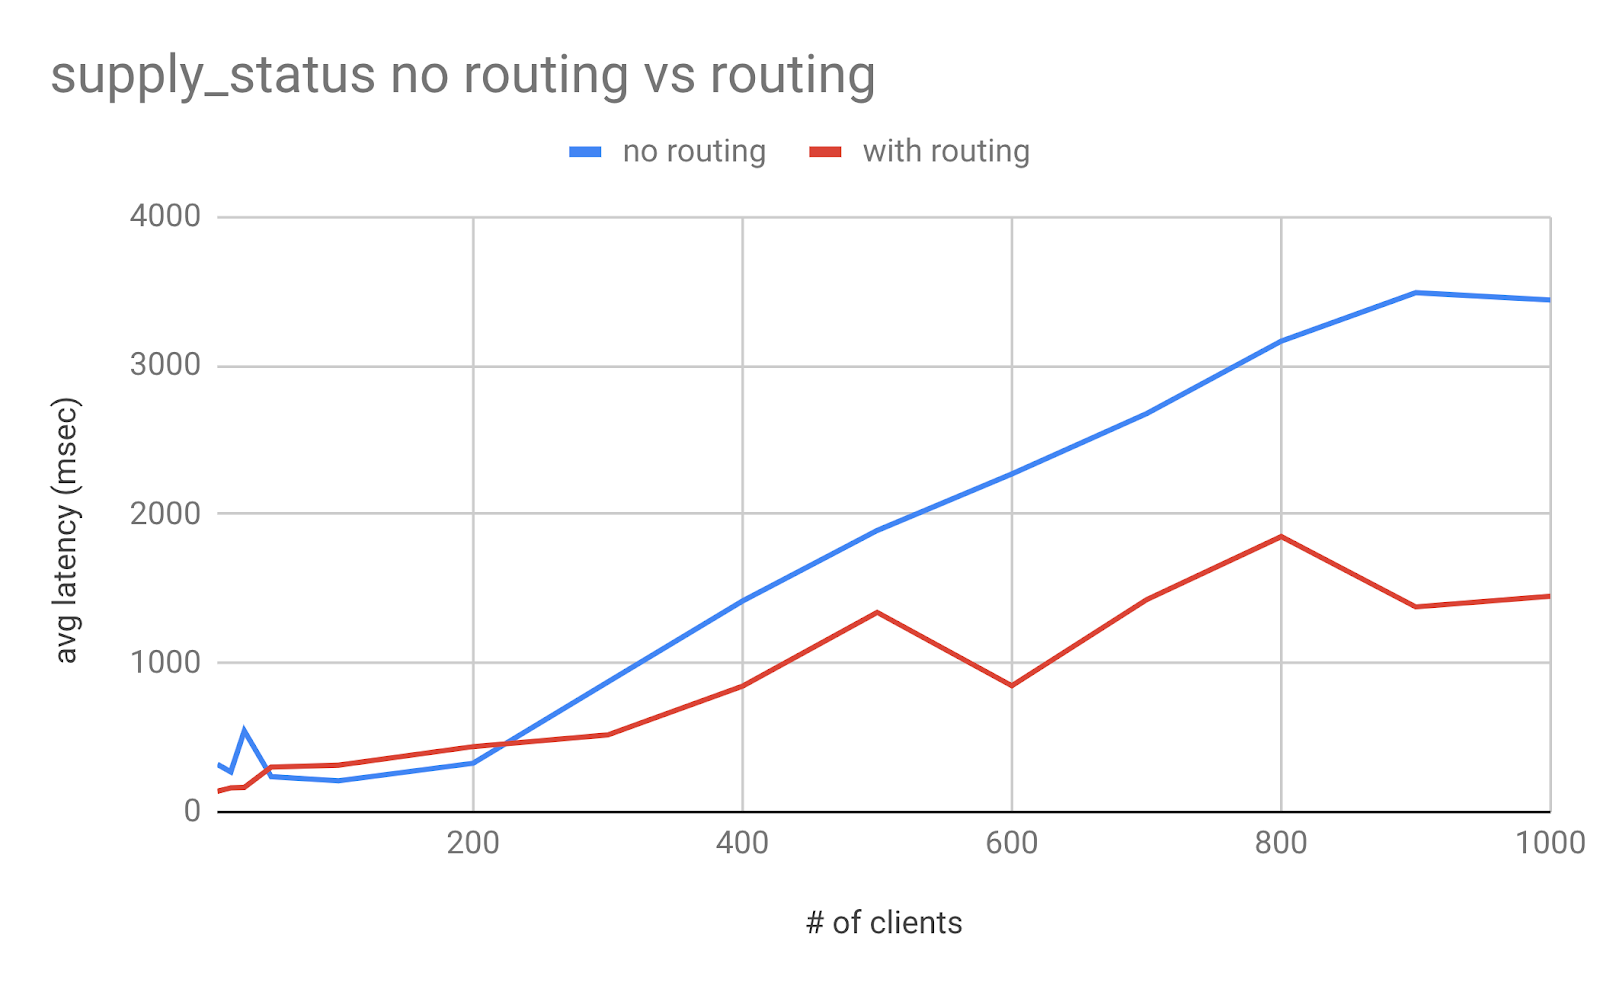
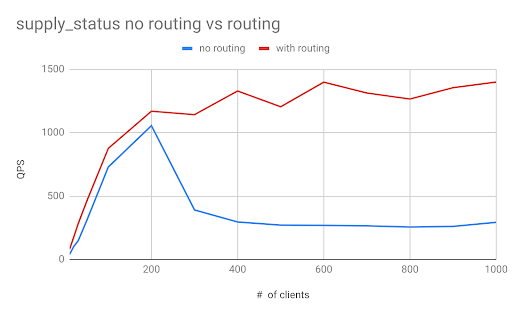
Figure 17 demonstrates that the average latency with sharding is higher when the number of clients is low. It is lower when the number of clients increases to over 200. The highest number of concurrent users it can support with sharding is about 4x compared to that without sharding, as shown in Figure 18.
In summary, the latency may be worse for some large data sources while the number of concurrent users it can support is consistently 4x of that without sharding. To gain in both latency and scalability for some large data sources, we can tune the partition size for each shard.
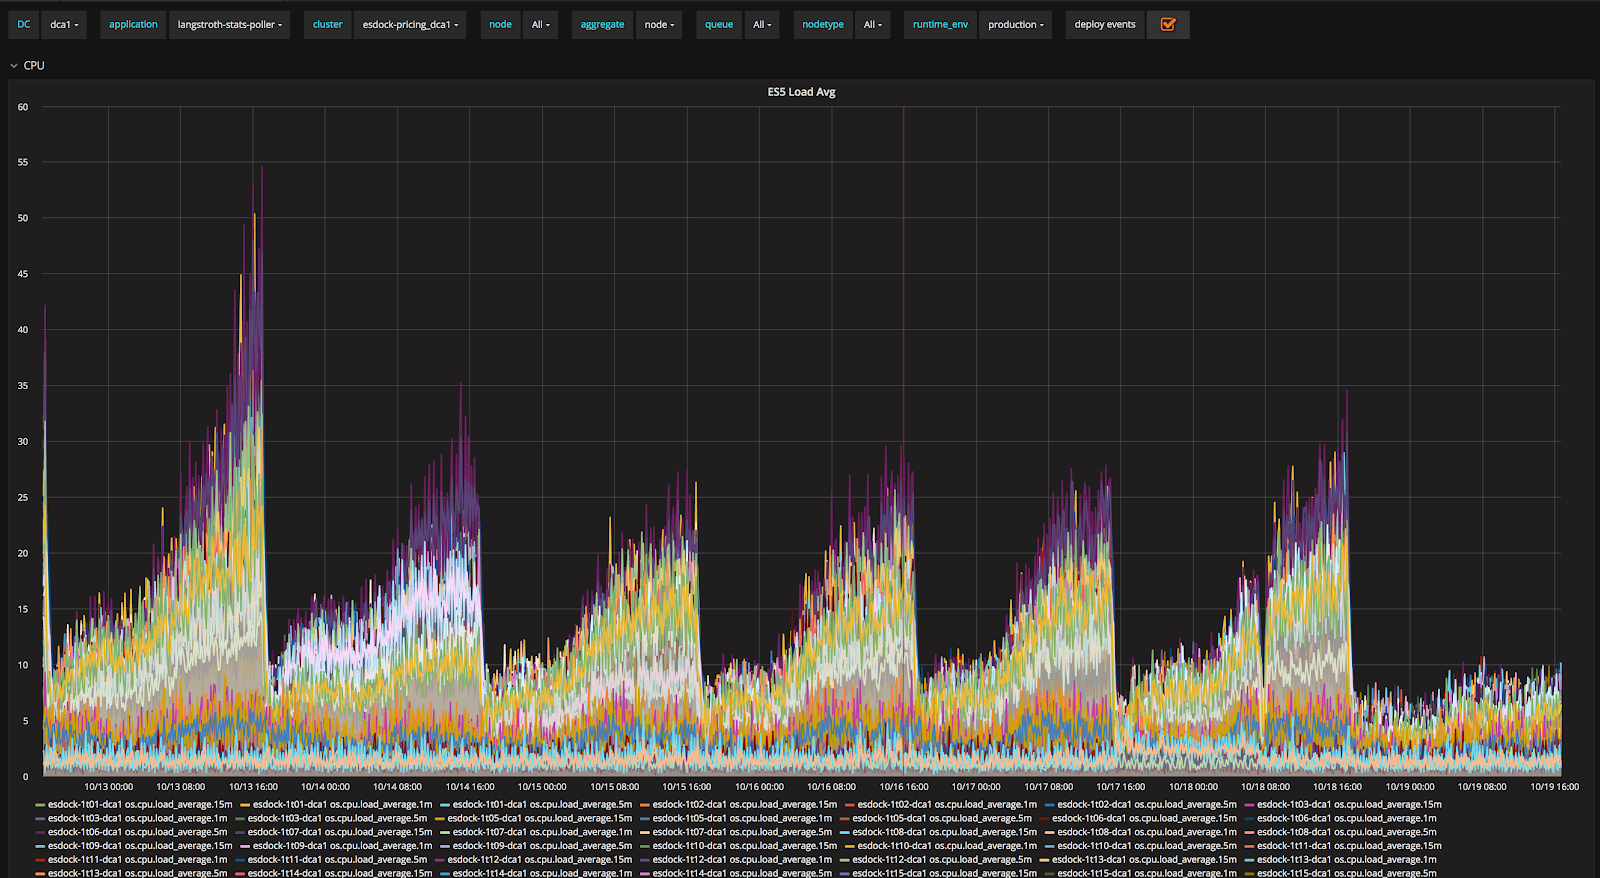
As a side product of sharding strategy, we are able to stabilize our pricing cluster as shown in Figure 19. CPU load for nodes in our pricing clusters shows a daily pattern because all indices are daily indices. During a day, it can be seen the CPU load increases as the time goes on. After the sharding strategy is applied to all data sources in the pricing cluster, the CPU load is stabilized.
Caching Based on Query Pattern & Signature
The simplest solution for caching is to cache all query results. However, due to the large-scale nature of our data, the total size of these results will be larger than the original data size.
Moreover, some queries are not executed very frequently and their cache hit rate will be low. To make caching more resource-efficient we introduce two additional concepts: query signature and query pattern. Let’s first take a look at a Gairos query example to see what a Gairos query looks like: 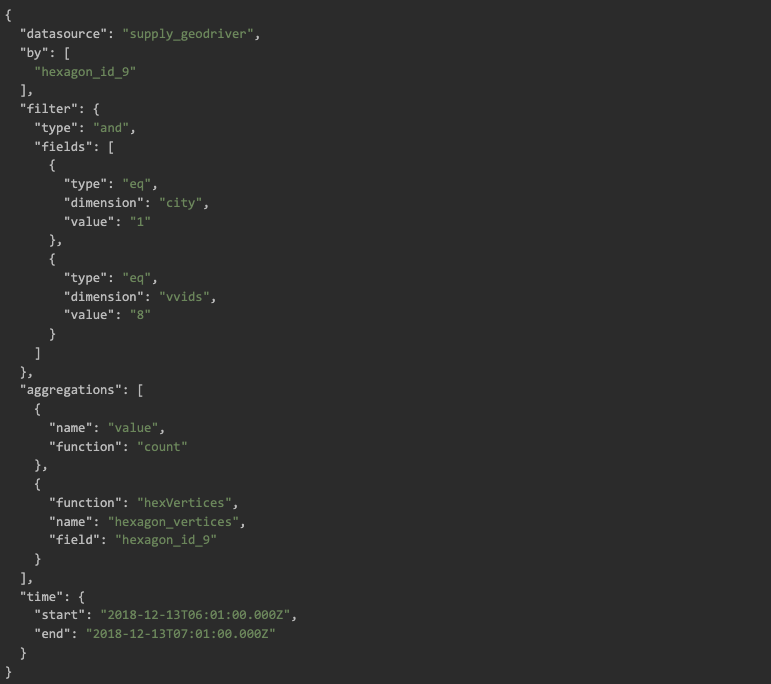
A Gairos query is a JSON object which may contain the following fields: data source, granularity, by, filter, aggregations, bucketBy, sort, limit, having etc. When defining the signature, only following fields are used: datasource, granularity, by, filter, aggregations, bucketBy, sort, limit. Query signature is generated from these fields with each field sorted.
A query pattern is defined with the same set of fields. The only difference is that query pattern will only consider the column used while not considering the operator and values used in filter. With query pattern and signature, Gairos queries can be analyzed more effectively.
Based on query patterns, we can define some caching rules for RT-Gairos so that RT-Gairos can cache results for frequently used queries. For example, the client pulls data from the last two weeks at some fixed interval (1 min, 5 mins, 1 hour etc.). If the data can be cached by day, the index hit rate will be much higher and cache can be used to improve the search performance. For repetitive queries with overlapped ranges, a similar strategy can be applied and, as can the time granularity based on the query patterns. To make the cache hit rate higher, a query split is required, during which each query will be split into multiple small queries based on data query time range if queries are splittable. For some aggregations, we can not get the aggregation results from individual subquery results. These queries will be stored in Elasticsearch clusters instead of being stored in cache.
Below we highlight the results of some benchmarking tests for caching rider_sessions, our sample dataset:
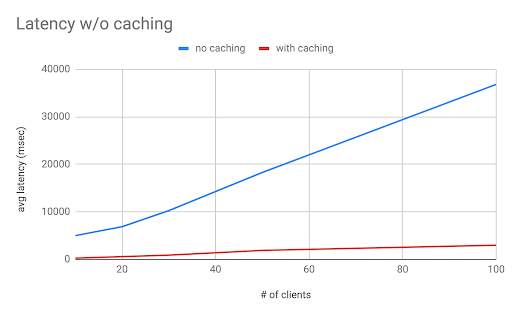
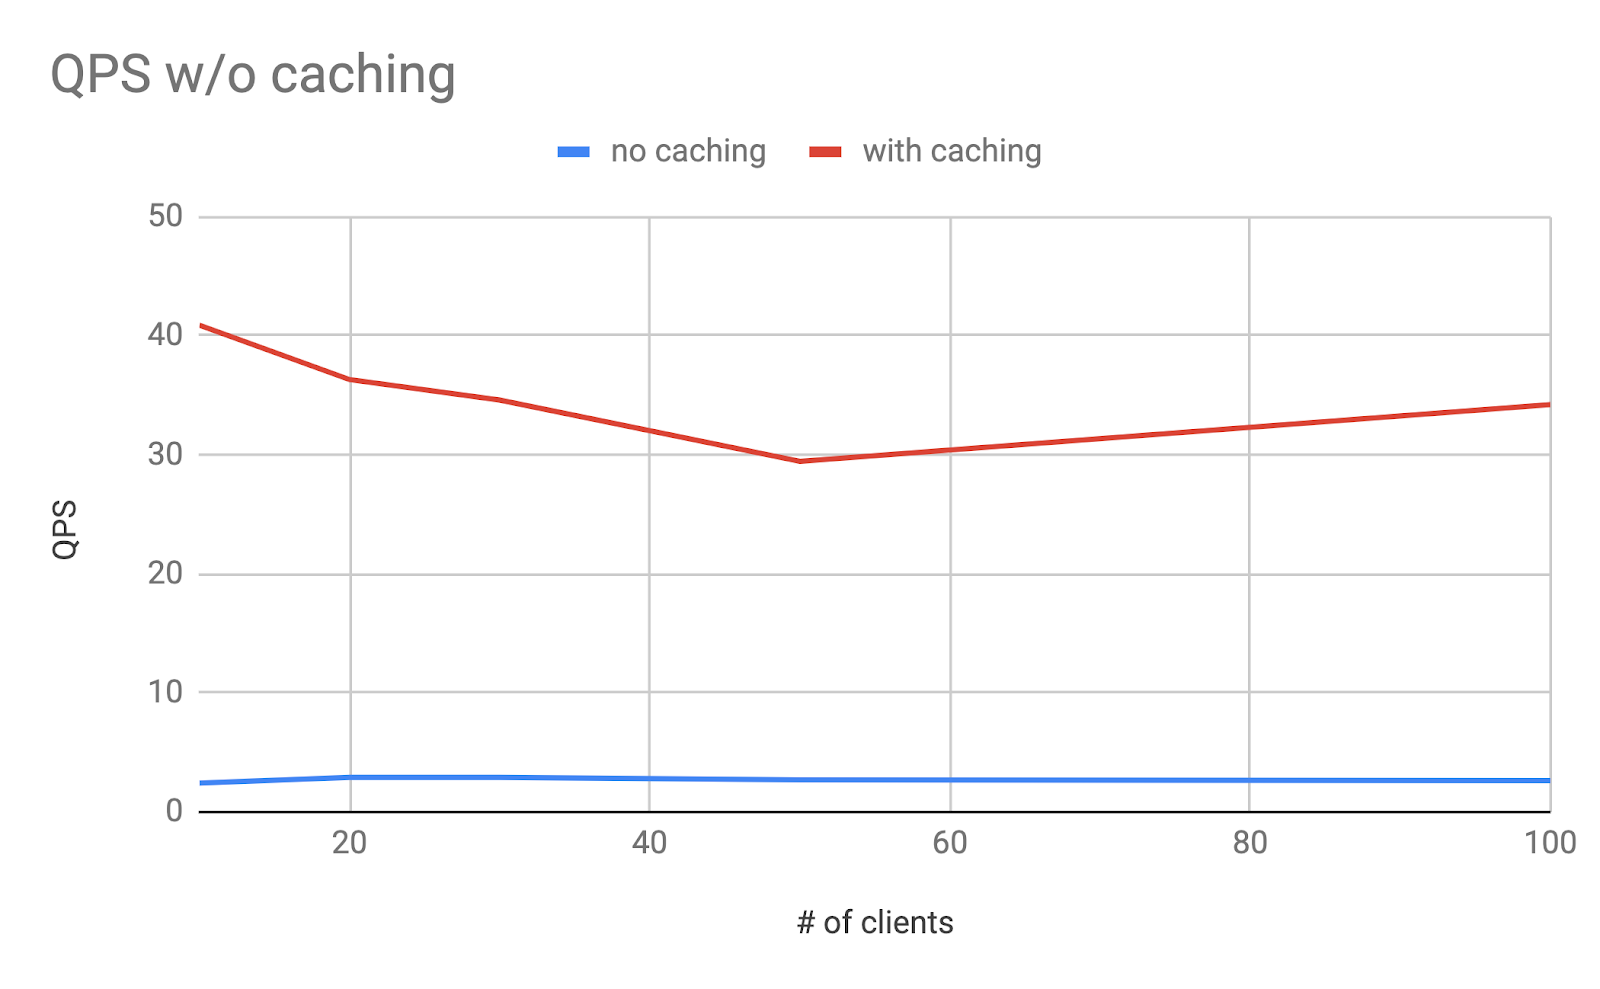
It can be seen from Figure 20 that average latency is much lower after we applied caching for these queries. The number of concurrent users it can support is much higher as shown in Figure 21. Since most queries for rider_sessions are heavy, more tests on other data sources will be done to justify our results.
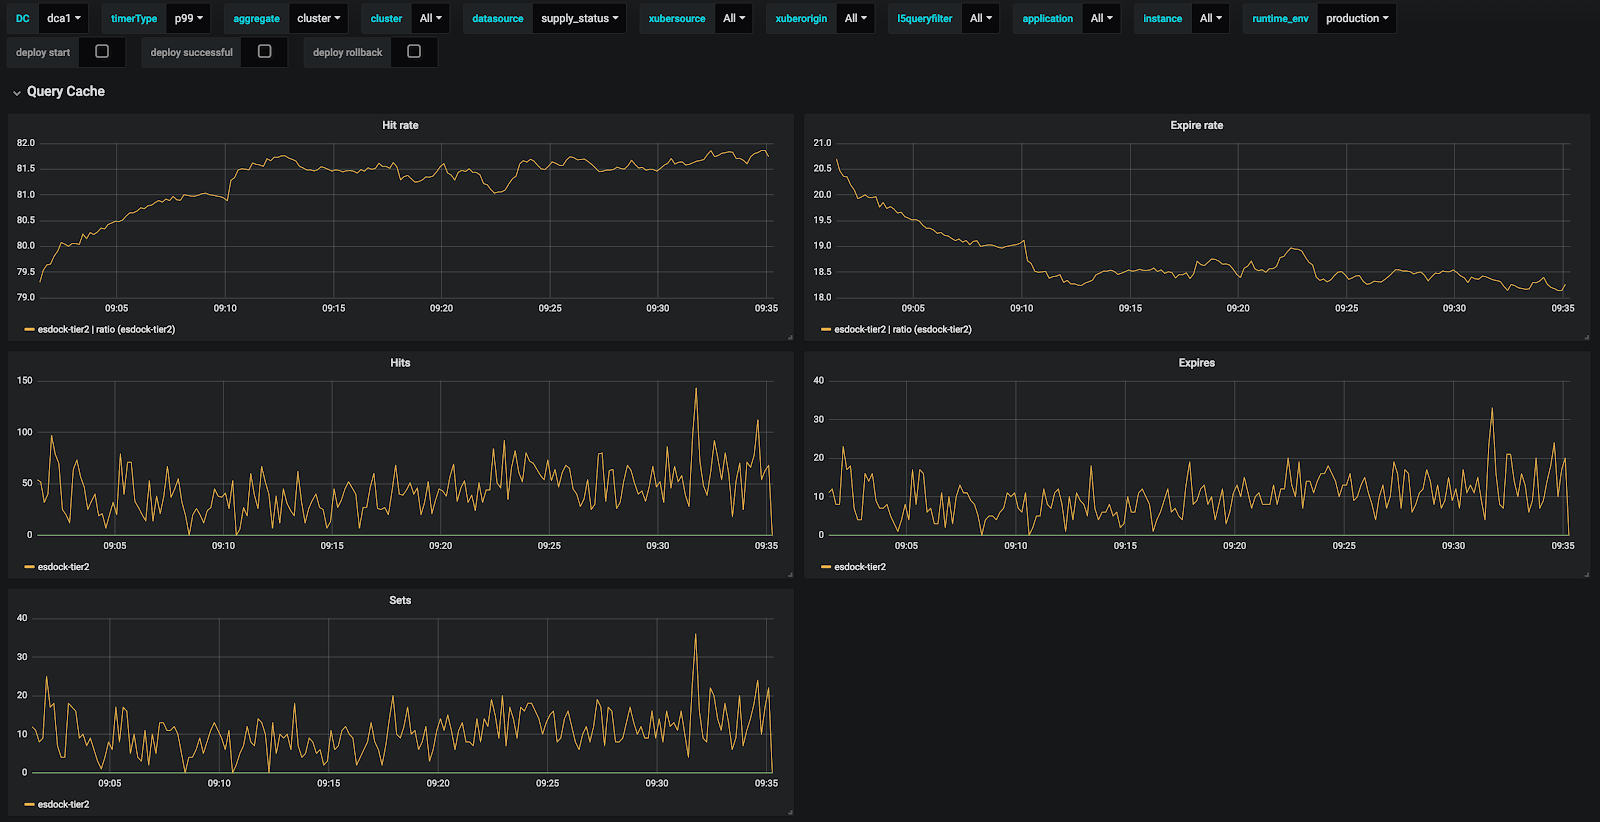
Cache stats for supply_status are shown in Figure 22. It can be seen that hit rate for supply_status is over 80%. Hit QPS is around 50 while sets QPS is around 10.
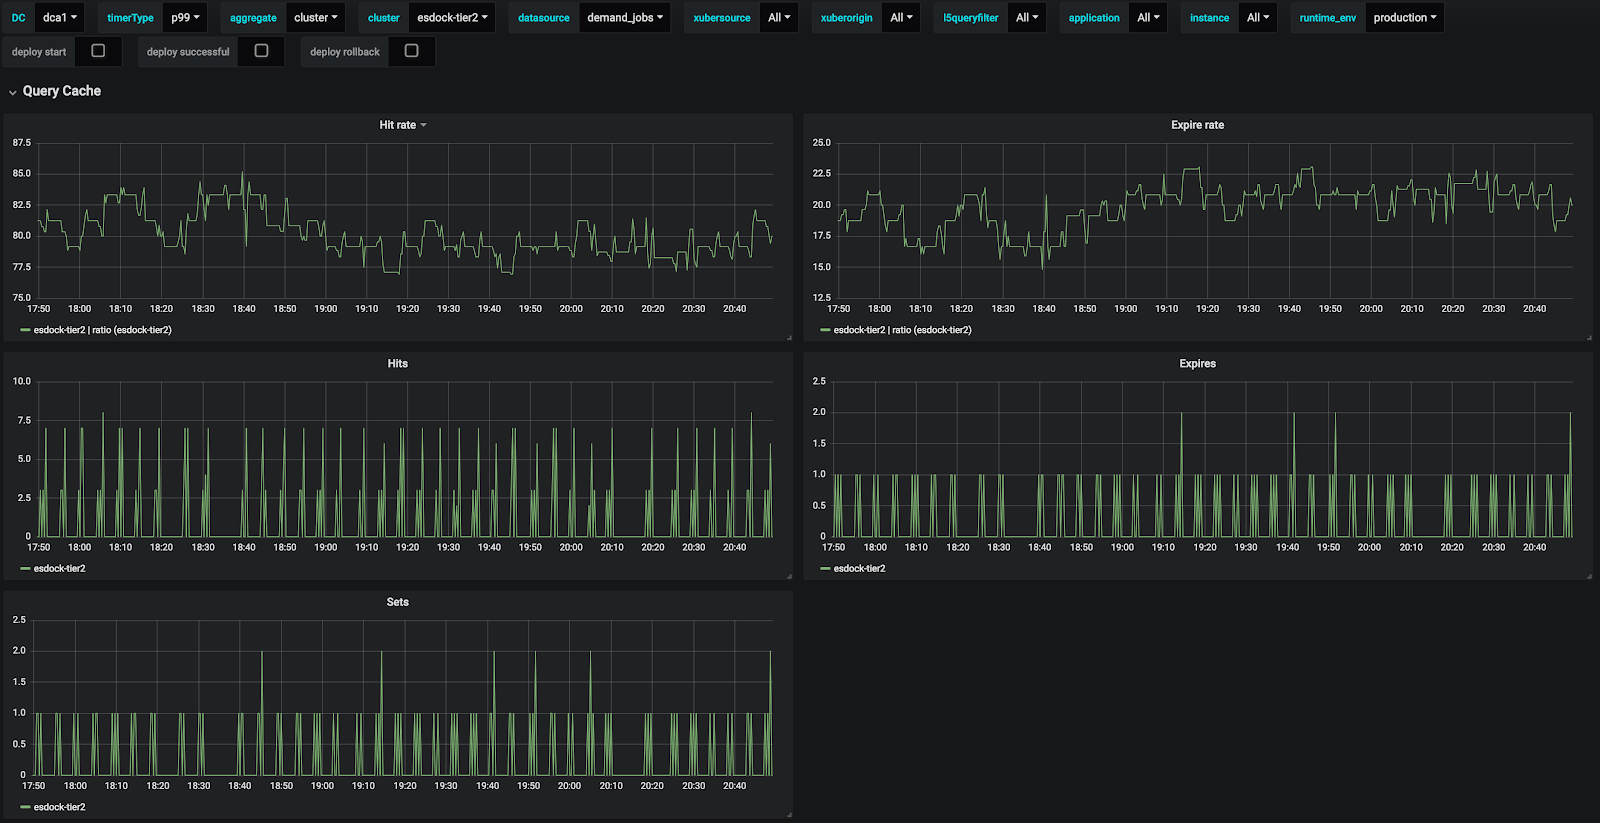
Another data source demand_jobs is shown in Figure 23. The hit rate is 80%.

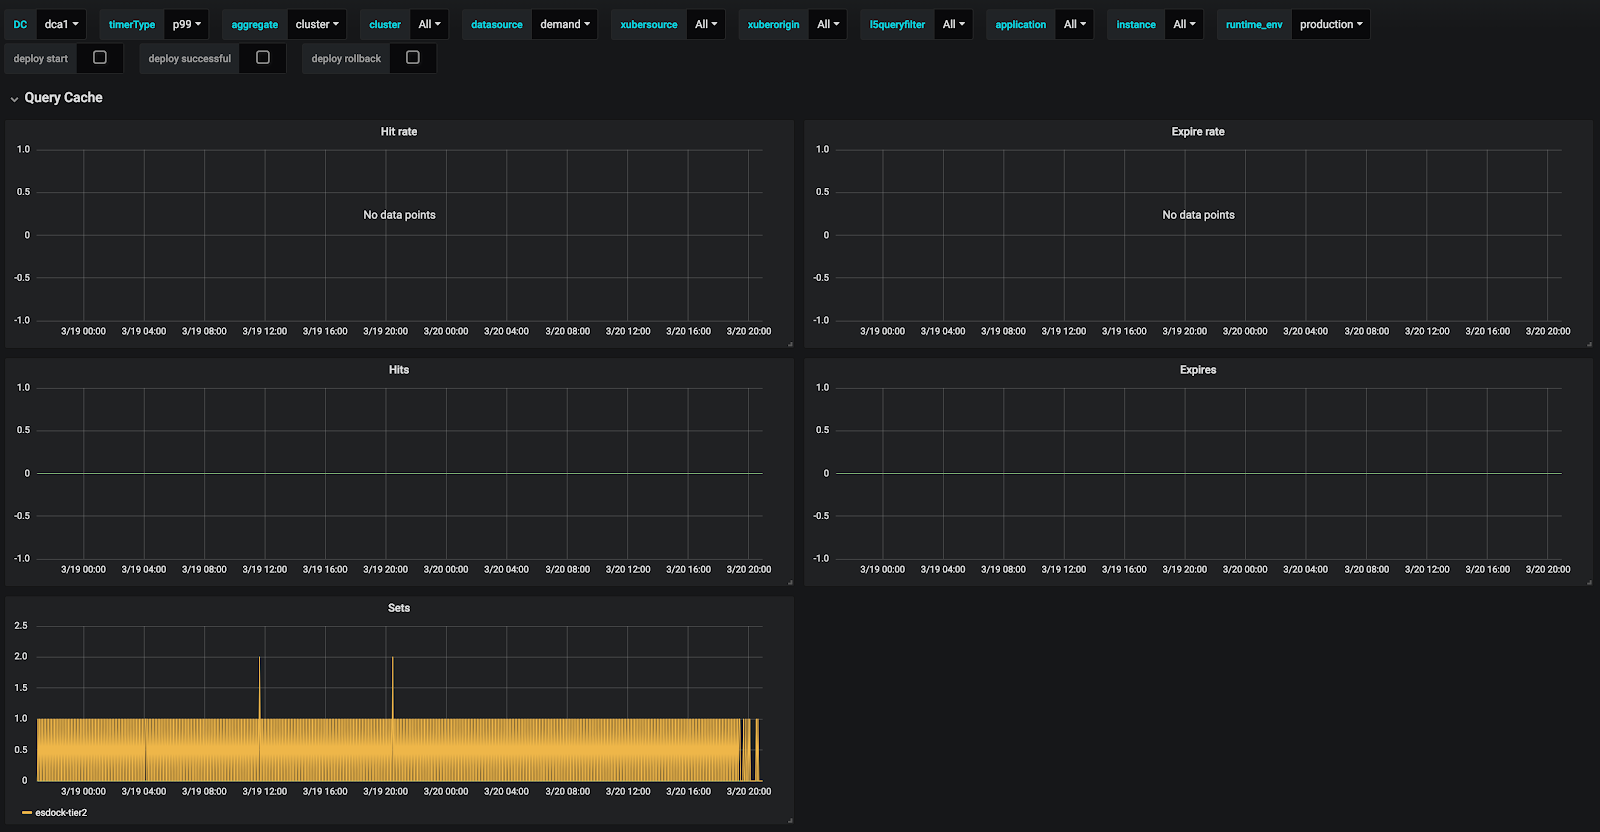
Last but not least, it can be seen from Figure 25 that cache hit rate is 0 for demand. It can be seen that the improvement with cache for different data sources varies a lot. We are planning to do more tuning to improve cache hit rate.
Merge Index
Elasticsearch is using inverted indexes to make search fast. When deleting a doc, the doc will be marked as deleted and it still exists in the inverted index. Deleted docs will be excluded from the search results. Index size will be much larger if there are a large number of deleted documents.
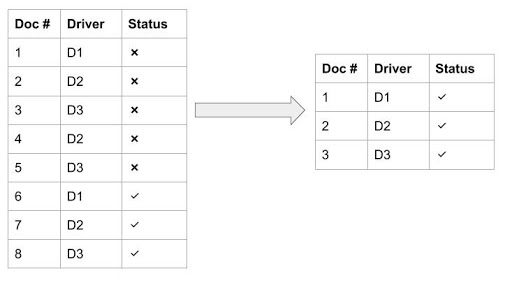
These deleted documents will affect search performance too. For example in Figure 26, below, drivers D1, D2, and D3 are updated several times. It can be seen that there are 8 docs while there are only 3 drivers. After merging the index, these deleted docs will be purged and the index size will be smaller.
Another important factor for enhancing index performance is the number of segments in an index. Some benchmark tests will be carried out to determine the best criteria we should use to decide when to merge indexes. Key metrics to be used for benchmark tests are index size (how big the storage is to store the index) and search latency (how long it takes to query the data). Queries collected from the real-time system will be used for search performance benchmarking.
Once the criteria for merging indexes is determined for each data source, optimization engine can carry out some index optimization tasks. The number of merging index tasks will be throttled by cluster so that reindexing will not impact the cluster performance that much. At most one merging index task can be running at any time to prevent significant performance degradation. If any significant impact is observed, all force merging tasks will be aborted.
Handling Heavy Queries
Some heavy queries may affect the performance of the whole cluster.
The following strategies can be applied to make the cluster more stable:
- Split Query: Split queries querying multiple indices into multiple small queries can limit the number of shards queried at any instant.
- Rate Limiting: Identifying the heavy query pattern and rate limiting heavy queries can improve cluster performance.
- Caching or Create Rollup Table: For some queries having a high hit rate, caching or rollup tables may be considered to improve the performance.
- Migrating to Hive/Presto: For batch use cases, some may be migrated to Hive/Presto.
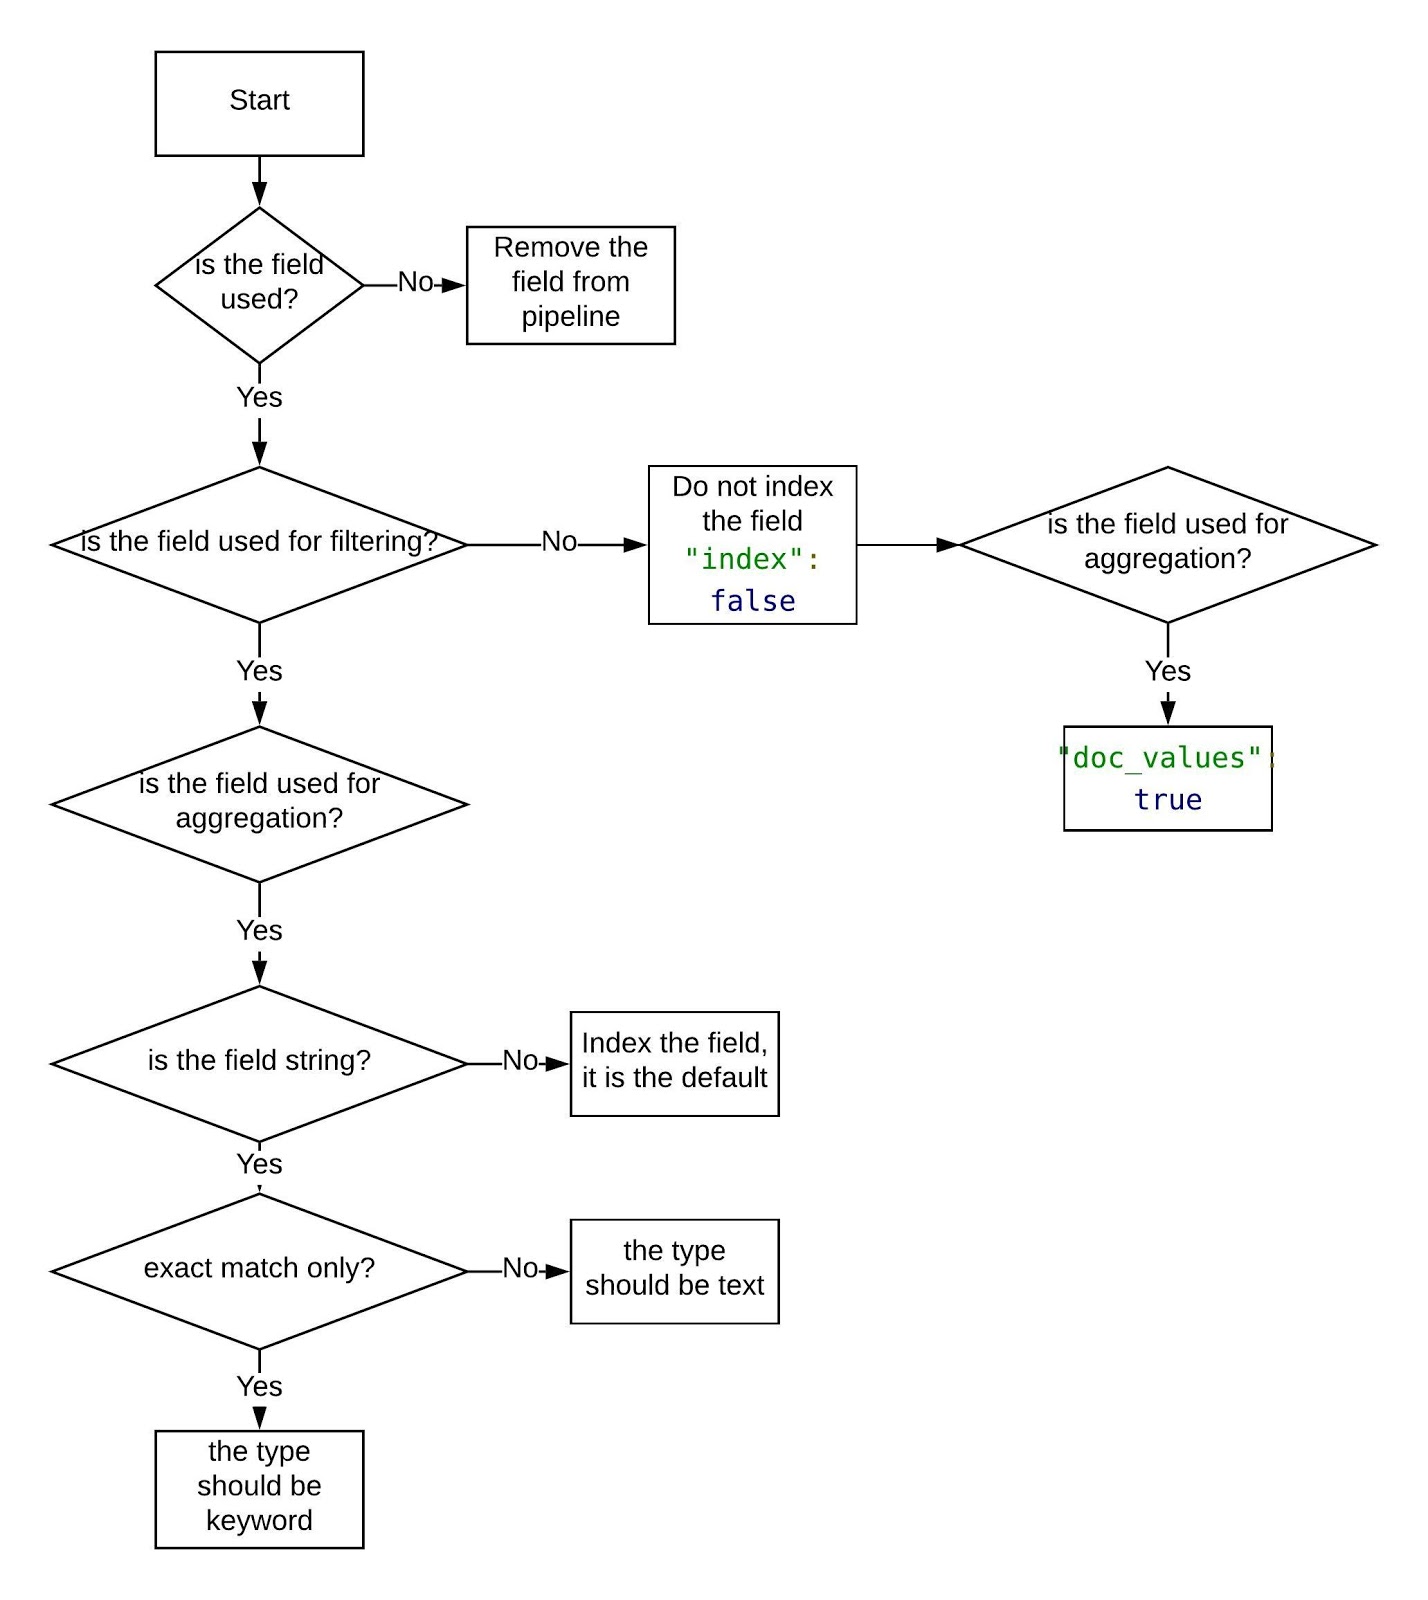
Indexing Template Optimization
From the queries run, following information can be obtained for each field in each data source so that we can decide the index setting for each field:
- Is it used?
- Is it used for filtering?
- Is it used for aggregation?
- Is it required for fuzzy search?
For each data source, the following question must be answered: whether users need to pull the raw data or not. Based on these inputs, optimal index settings can be obtained for each data source. The optimization engine can update the templates stored for a data source so that we can get better in terms of disk space or search performance. Some settings (ex. disable source) will not be backward compatible and it will need some approval before execution. Please note that disabling source will make update and reindex impossible. If the business logic needs to update the doc, the source should not be disabled.
Since data is persisted automatically and easily be replayed, it is easier to make the publishing Apache Kafka topic a heatpipe topic before disabling source so that data migration can be done through replaying events in the persisted Apache Kafka topic.
Figure 27 shows the detailed workflow to determine the setting for each field.
Shard # Optimization
For each data source, one index will be copied to the staging cluster and reindex tool will be used to reindex the copied index to different numbers of shards. Benchmarking tests will be carried against the copied index and reindexed index to gather performance data. Queries used will be from user queries gathered in the past. Once the best shard # for each data source is identified, query optimization can set the new shard number in new indices.
Bound Index Range
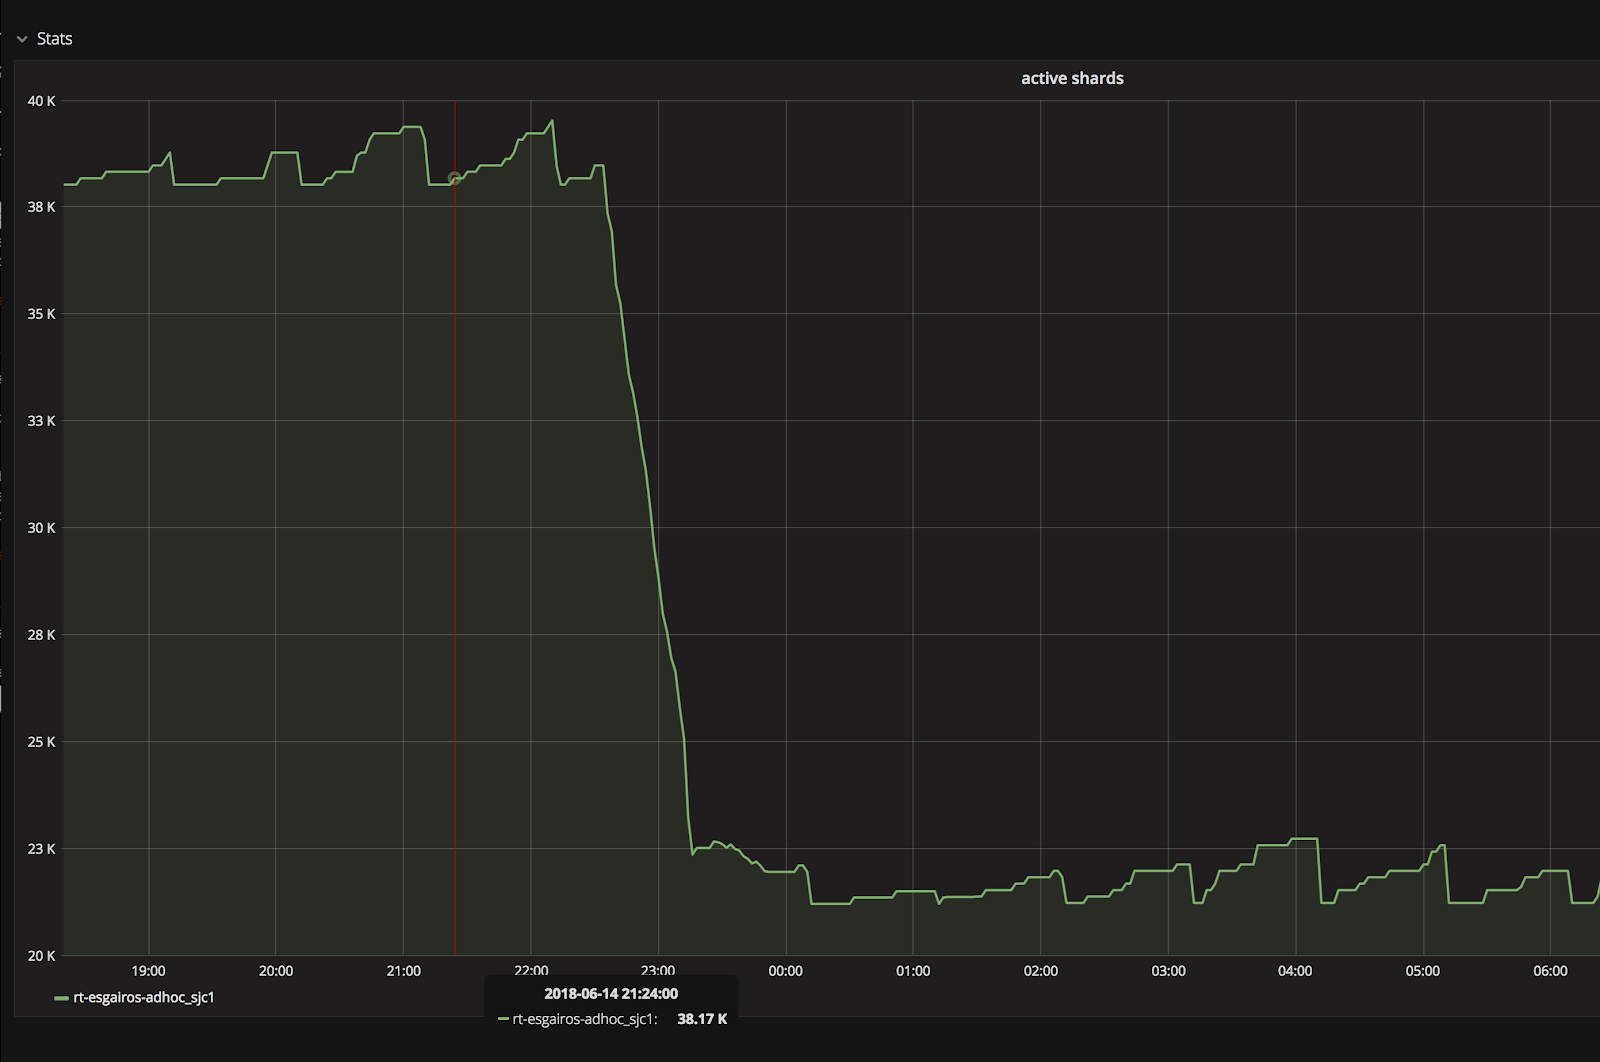
It is observed there are a lot of very small indices created in some clusters. The number of shards for these indices is large. It causes shard allocation problems in the cluster. Some nodes may have a lot of unused shards while some nodes have quite a few busy shards, which can cause an unbalanced load among nodes and a low resource utilization rate.
These small indices are usually due to events with timestamps out of bounds. When writing to Elasticsearch clusters, data will be filtered based on data retention and data prediction for each data source so that these near-empty indices will not be created and reduce the number of shards. The following is one example for one cluster. Figure 28, below, demonstrates that the number of shards drops from around 40k to 20k after cleaning up these small indices in one of our clusters:
Purge Unused Data
Collected queries can determine whether a data source was used in the last X days. Based on this information, Gairos Optimization Engine can carry out various data purging tasks, such as trigger notifications and delete indices for data sources in the datastore.
Future Work
These optimization strategies have been applied in several major data sources. We are planning to extend the optimization coverage to all data sources especially for sharding and caching.
The whole process is not automated. We will put more effort into automating the whole process once we accumulate enough domain knowledge from optimizations of these data sources with these optimizations applied.
For query analyzer, some machine learning/deep learning methodologies may be applied too. It is in our roadmap and will be explored in future iterations. If you are interested in joining the Marketplace Intelligence team, tackling challenges for large scale streaming (e.g. Flink, Samza), OLAP (e.g. ElasticSearch) and ML (e.g. ETD prediction), please apply to join our team!

Wenrui Meng
Wenrui is a Senior Software Engineer at Uber working on real-time data metrics optimization.

Qing Xu
Qing was an engineering manager of Marketplace Intelligence at Uber.

Yanjun Huang
Yanjun Huang was a senior software engineer on Uber's Core Infrastructure team and is an Elasticsearch Expert.
Posted by Susan Shimotsu, Wenrui Meng, Qing Xu, Yanjun Huang
Related articles


How LedgerStore Supports Trillions of Indexes at Uber
April 4 / Global
Most popular

Balancing HDFS DataNodes in the Uber DataLake
Model Excellence Scores: A Framework for Enhancing the Quality of Machine Learning Systems at Scale
The Easter Shop and Pay with Uber Eats Gift Card Sweepstakes Official Rules

UberX Priority FAQ
Products
Company
