Power On: Accelerating Uber’s Self-Driving Vehicle Development with Data
June 4, 2019 / Global
A key challenge faced by self-driving vehicles comes during interactions with pedestrians. In our development of self-driving vehicles, the Data Engineering and Data Science teams at Uber ATG (Advanced Technologies Group) contribute to the data processing and analysis that help make these interactions safe.
Through data, we can learn the movement of cars and pedestrians in a city, and train our self-driving vehicles how to drive. We map pedestrian movement in cities with LiDAR-equipped cars, search video collected from the roads for interesting, real-life situations that can be used in model training, build and report on simulations, and test on both a closed track and real roads to reinforce our training.

The computer brain of a self-driving vehicle can only understand its environment through data. Through our data collection and modeling, we strive to give our self-driving vehicles the deepest understanding of cities possible.
The Data Engineering and Data Science teams at Uber ATG play a crucial role in charging the batteries with data and powering the system with insights. To start, the Data Engineering team takes charge of collecting data from disparate sources and makes it analyzable. The Data Science team then picks up the baton to discover insights from the data.
A city full of data

To understand the cities in which a self-driving vehicle drives, we begin by asking questions: How many pedestrians walk a typical street? How quickly do they walk? How often do they cross the street? In essence, we try to determine the challenges a self-driving vehicle might face on real roads in order to define the capabilities needed to face those challenges. For example, the ways pedestrians cross the street on real roads informs how the self-driving vehicles should behave in those encounters.

But how do you start to answer these questions? One approach is to drive a car with cameras and LiDAR to record how pedestrians move on real city streets.
For example, in Figures 2 and 3, above, we depict several map-based visualizations of pedestrian activity as recorded by ATG’s self-driving vehicles. The dotted white line indicates where the self-driving vehicle drove while the colored dots and circles indicate walking and standing pedestrians. To make visualizations like this, the ATG Data Engineering team starts by creating pipelines that move raw data collected from a self-driving vehicle into formats that a data scientist can analyze. The Data Science team then analyzes the data to extract insights, such as the characterizations of pedestrian movement, information that facilitates the development of machine-learned models for detecting pedestrians, an essential capability of self-driving vehicles.
Machine learning in the city

Characterizing pedestrian movement creates the opportunity to identify specific situations where a self-driving vehicle may encounter a pedestrian, for example, when they use crosswalks. With thousands of such examples, it then becomes possible to train a machine-learned model to understand and predict pedestrian behavior with very high accuracy. In the visualization above, a data scientist uses data teed up by the Data Engineering team to search historical logs and find areas in the city where there are lots of pedestrians. Specific examples among these are then used in model training to better simulate pedestrian behavior in a city, resulting in more accurate simulations of real pedestrian behavior.
To simulate a city
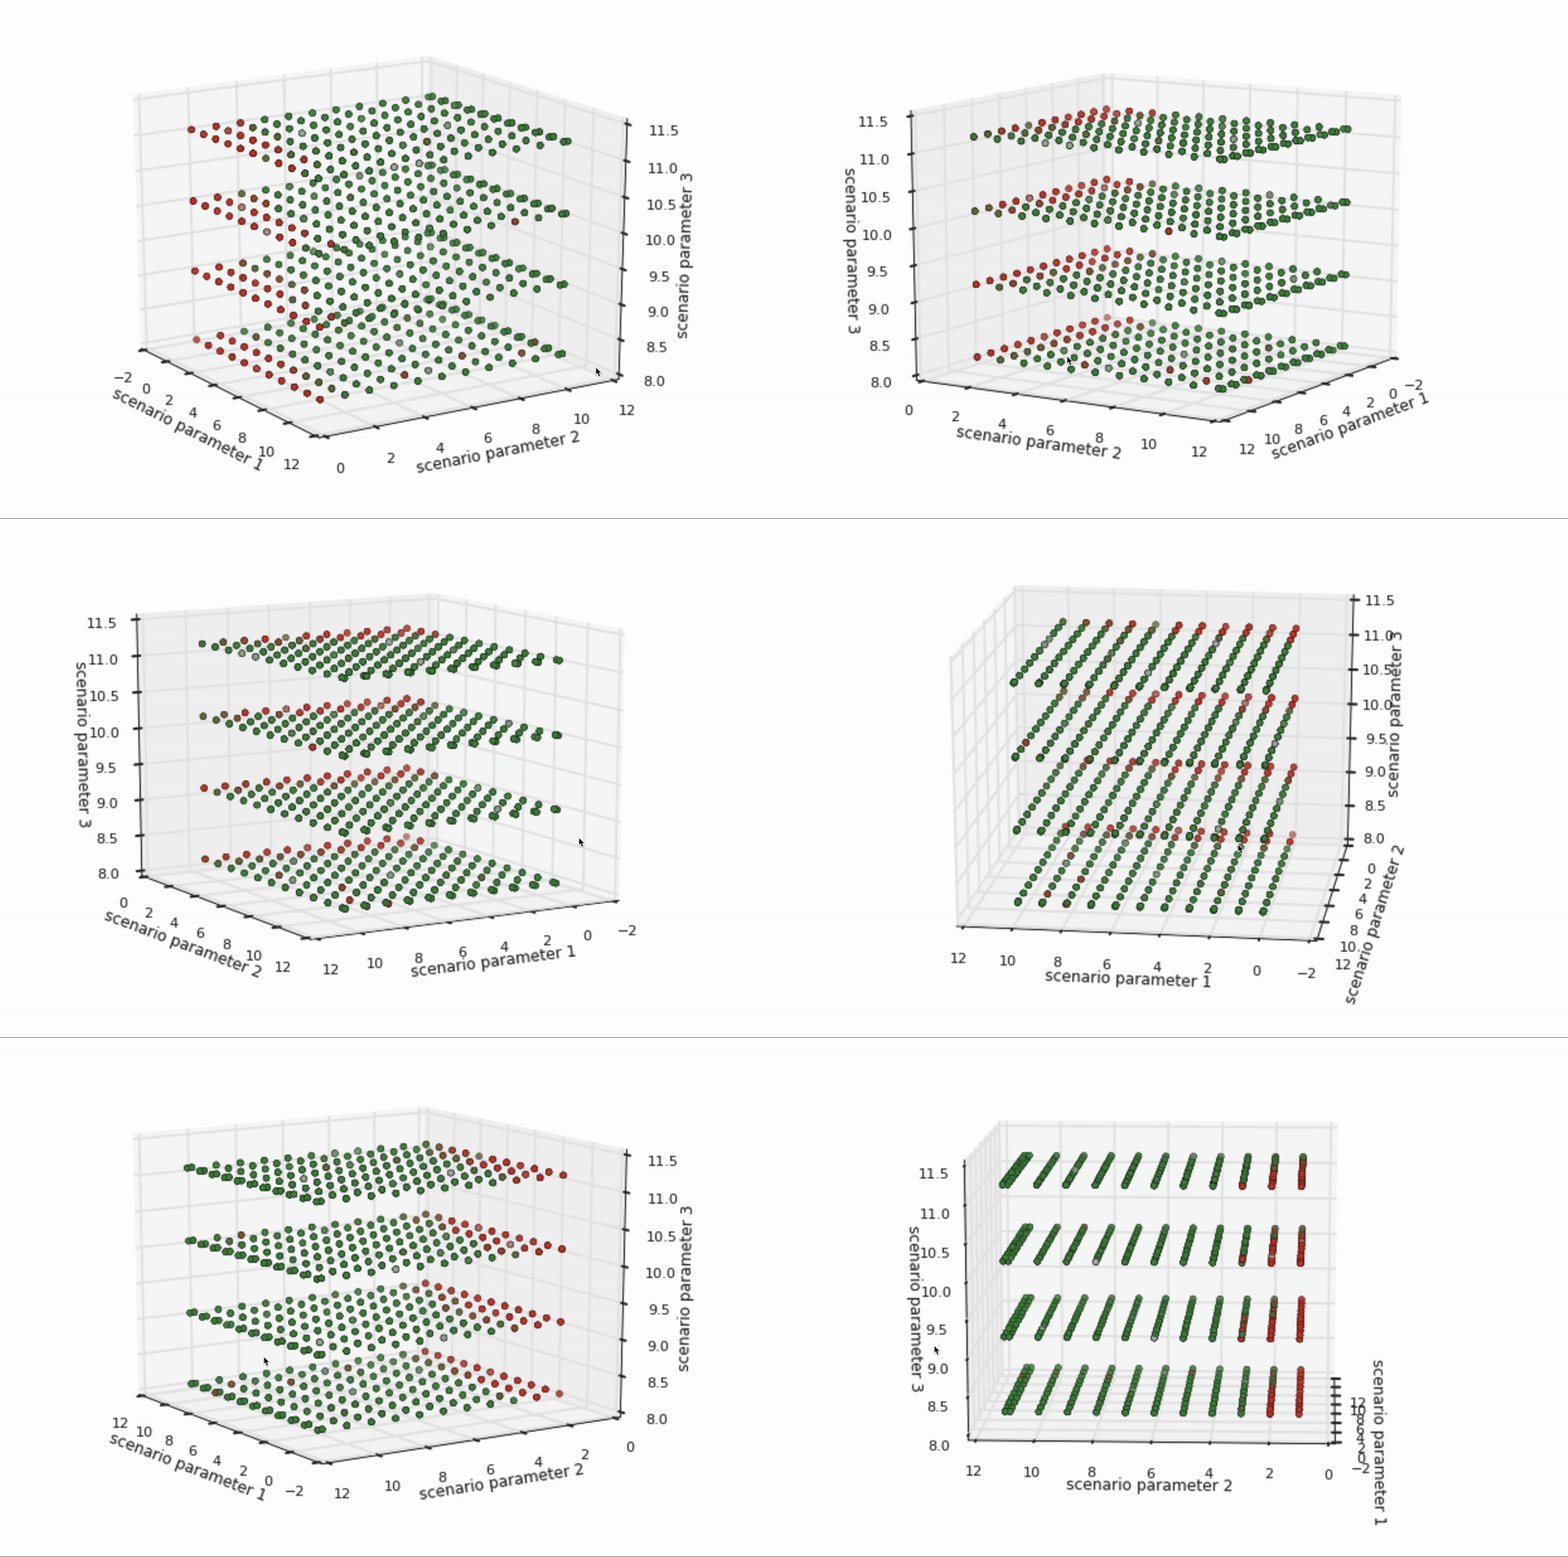
Knowledge of pedestrian movement in a real city informs the construction of simulated cities, too. For example, a diverse set of pedestrian examples from the road help define representative sets of pedestrian simulations. These definitions align the simulated world with real-world behavior—and there are many such alignments to make. For example, how fast do pedestrians walk on average? How quickly do they start and stop walking? Do they zig or zag more? What are their styles of jaywalking? It’s helpful to set high and low ranges of values for all of these situations to make sure that simulated variations cover the variations seen, or expected to be seen, in real pedestrian behavior.
Figure 5 depicts the pass/fail results of hundreds of variations of a specific scenario across three dimensions of parameters, such as the speed a pedestrian walks. The boundary between the green dots (passes) and red dots (fails) is where the self-driving vehicle software can no longer handle the scenario’s conditions (such as if a pedestrian moves faster than what can be expected from a human). This boundary represents either opportunities for software improvement or opportunities for scenario refinement, as when the situation is not realistic.
A miniature city at the track

Track testing connects simulated results back to the physical world. The pedestrian characterization data used to inform simulated scenarios is also used to improve the design of pedestrian scenarios on the track. Above is a visualization of self-driving vehicle data on the track colored to indicate where different tracking values occur over the course of many scenario tests.
When safety-critical scenarios succeed on the track, it’s a meaningful signal to the safety team that the self-driving vehicle has the capability to drive on the same city streets where those scenarios were first observed.
Continually learn the city through road testing

Driving on real city streets brings us full circle to where we started. Road operations help ATG both test the self-driving vehicle on public roads while collecting new data for analysis. This data-powered feedback loop indicates whether the scenarios we expect the self-driving vehicle to encounter match reality and the capabilities tested.
Above is a visualization of a map that a self-driving vehicle uses to navigate real city streets from the point of view of a data scientist. With the map data made available for analysis it becomes possible to, for example, select lanes of a specific type and analyze them individually. These lanes are colored to represent different volumes of pedestrian activity.
From driving real city streets, to training models based on the collected data, to building and testing scenarios for simulation and on the track, to returning to drive on real city streets again, data is an indispensable part of developing and operating self-driving vehicles. For a car that drives itself, data is the fuel.
Interested in pushing the transportation needle forward with Uber ATG? Consider applying for a role on our team!

Steffon Davis
Steffon Davis is a product manager with Uber's Advanced Technologies Group, working on the development of self-driving vehicles.
Posted by Steffon Davis
Related articles

How LedgerStore Supports Trillions of Indexes at Uber
April 4 / Global
Most popular

Stopping Uber Fraudsters Through Risk Challenges
Scaling AI/ML Infrastructure at Uber

Information for driving during the week of Super Bowl LVIII

Uber Reveals 2023 “Airport of the Year” Award Winners
Products
Company
