
With operations in over 700 cities worldwide and gross bookings of over $16 billion in Q3 2019 alone, Uber leverages forecast models to ensure accurate financial planning and budget management. These models, derived from data science practices and platformed for ease of use, help our business users project how their spending allocations will affect key revenue metrics.
However, as anybody who looks at a weather report knows, forecasts are not always accurate. To better assess the performance of our models, we built a backtesting service for measuring forecast model error rates. This service benefits us two-fold: it builds trust with our internal business users and empowers data scientists to make targeted improvements to forecast predictions.
Today, our service supports all Python-based time-series forecasting models, including multivariate models. The backtesting service runs in a distributed system, allowing multiple models (>10), many backtesting windows (>20), and models for different cities (>200) to run simultaneously. Our service has backtested many models within Uber’s finance organization, and the results provide valuable insights for both model developers and business decision-makers, allowing us to improve our services for users worldwide.
Backtesting at scale
Our data science teams regularly create forecast models and statistics to better understand budget spending and project financial performance. These models are critically important to our strategic finance teams who count on them to decide where and how to funnel future spending. After all, a budget is only as good as the data that supports it.
To ensure our forecasts are as accurate as possible, we need a service that supports a tight feedback loop—showing where the forecasting models fall short—for data scientists to iterate quickly and effectively. In addition, a tight feedback loop ensures that business decision-makers have a holistic and nuanced view of statistics and models for financial planning.
To backtest our financial forecasting models, we have multiple dimensions to consider. Figure 1, below, shows an example of several dimensions that we have to cover in our backtesting:
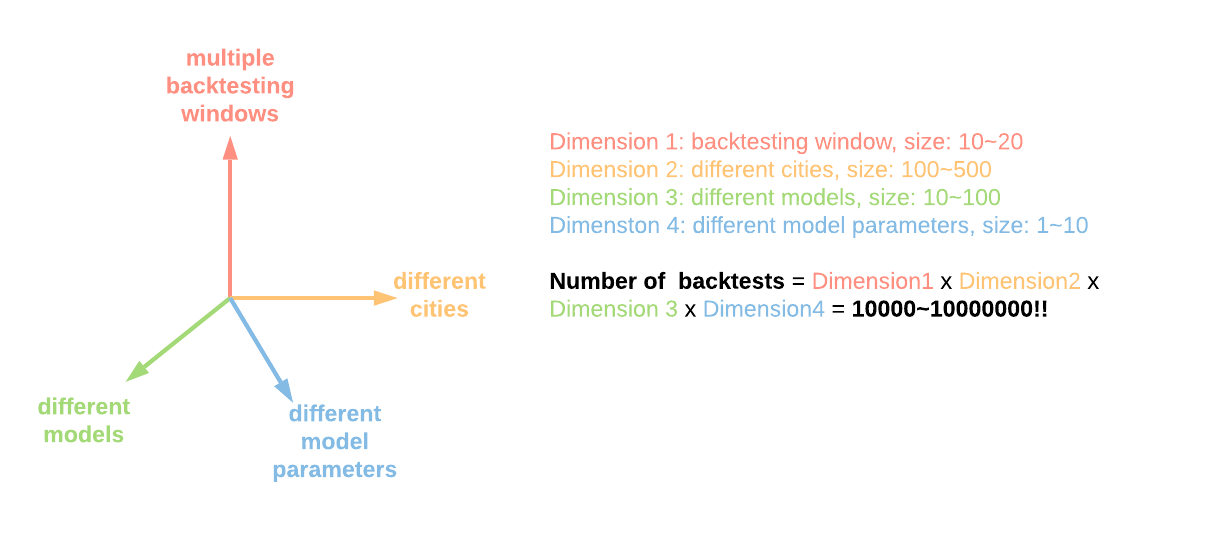
As depicted in Figure 1, one of the dimensions is the number of backtest windows. Our data scientists can backtest both monthly (with a window of one) and annual (with a window of 12) models to account for seasonality.
Before settling on building a new solution, we assessed various existing backtesting services that have been developed (for instance, Omphalos, our parallel and language-extensible backtesting tool used for demand forecasting) at Uber, and originally planned to leverage them. However, these services were created for a specific environment and could not support our need to orchestrate and compute at a scale of 10 million backtests, owing to Uber’s ever-increasing scale of operations.
Existing services were also missing a few other features we needed, including the ability to cover multivariate models and automate objective performance measurement of forecasting models. They also lacked a standardized service for machine learning engineers and data scientists to track model performance over time as forecasting models are tuned and updated, which was particularly important for our financial use case.
To address these and other missing features, we developed a novel backtesting service that provides a single system that empowers both business users and data scientists to evaluate the model objectively as a comprehensive one-stop-shop.
The importance of measuring model accuracy
One of the first considerations we had before building this service was how to express and calculate model accuracy. To better understand how this expression would work, we needed to compare the prediction results with actual historical data. The first step was to split the data set into training and testing sets. Unlike cross-validation, backtesting leverages time-series data and non-randomized splits.
For the purposes of our backtesting service, we chose to leverage two primary backtesting data split mechanisms, backtesting with an expanding window and backtesting with a sliding window:

Above, we showcase three windows for each method. Each window is split into training data, which is used to train the model, and testing data, which is used to calculate the error rate for the trained model.
To measure the error rate, our new backtesting service employs different methods. One of the most popular methods used by data scientists at Uber is MAPE (mean absolute percentage error):
![]()
The lower the MAPE, the better a forecast model performs. Usually, data scientists compare the results of error rate calculation methods used by the same model to ensure they express what actually went wrong with the forecast. For example, while MAPE is the standard forecast error measurement method, it cannot handle a time period with zero value (as no formula can have a zero in the denominator). In this use case, City A, which may be rolling out operations in February will have zero trips data in the month of January despite still needing to leverage promotional budget, but, after a February launch, will support incrementally more trips month-over-month through the rest of the year.
In addition to MAPE, users can employ other error measurement methods to better understand the error rates. On top of that, users can also run different backtesting methods (using either expanding or sliding windows) and error calculation methods in parallel using the service, expediting forecasts and leading to both quicker and more accurate decision making.
System Architecture
To build this backtesting service, we leveraged several existing data science tools at Uber, including Data Science Workbench, Uber’s interactive data analytics and machine learning toolbox, and Michelangelo, Uber’s machine learning platform. At a high level, machine learning models are uploaded through Data Science Workbench and backtesting requests on model data are submitted using a Python library that relays the request to the Backtesting service written in Go service. Once an error measurement is calculated, it is either stored in our datastore or immediately put to work by data science teams, who leverage these prediction errors to optimize machine learning models in training.
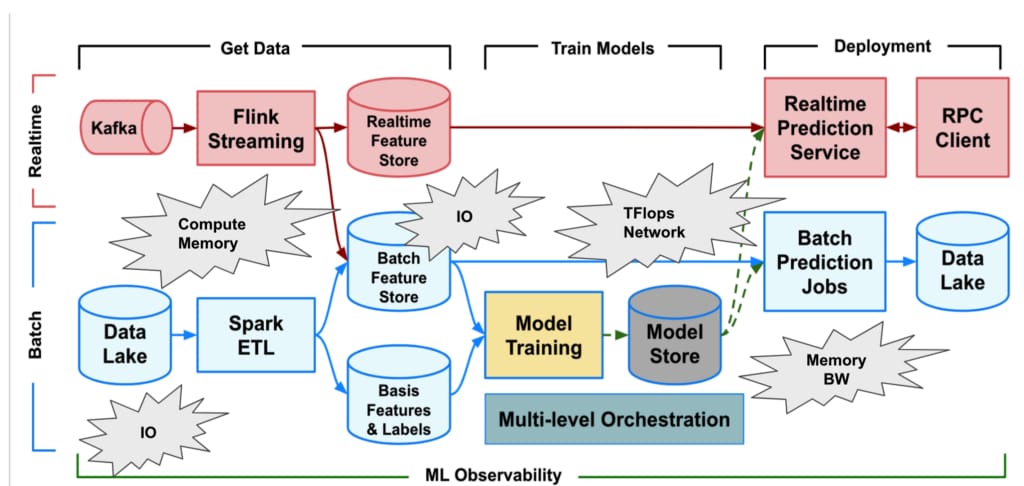
Figure 3, below, highlights the major components of the backtesting system (in green): a Python library and a Go service:
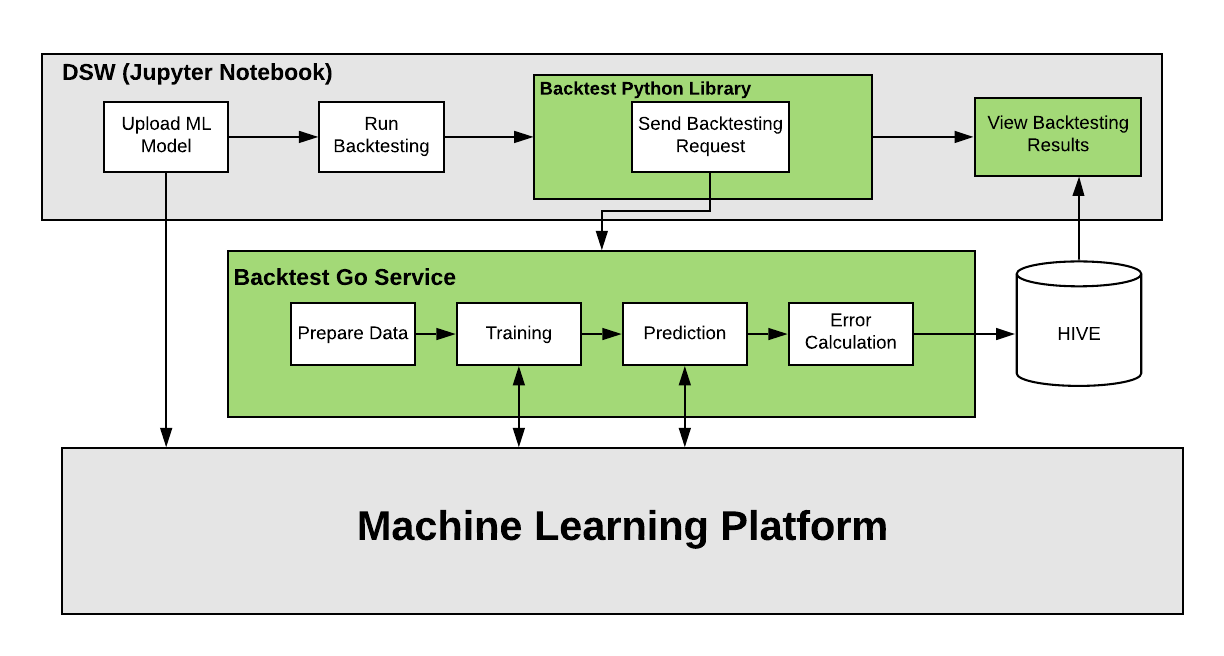
Zooming in on these components, our Python library acts like a Python client. Since many ML models at Uber are currently written in Python, it was an easy choice to leverage this framework for our backtesting service, which allows users to seamlessly onboard, test, and iterate on their models.
The main backtesting logic for our system is written in Go as a series of Cadence workflows. Cadence is an open source, orchestration engine written in Go and built by Uber to execute asynchronous long-running business logic in a scalable and resilient way.
Backtesting service workflow
Uber’s Financial Technology team uses our backtesting service to develop forecast models and monitor model performance. We have two targeted users for this service: data scientists and machine learning engineers. Let’s highlight how our backtesting service works by walking through a typical use case, as depicted in Figure 4, below:
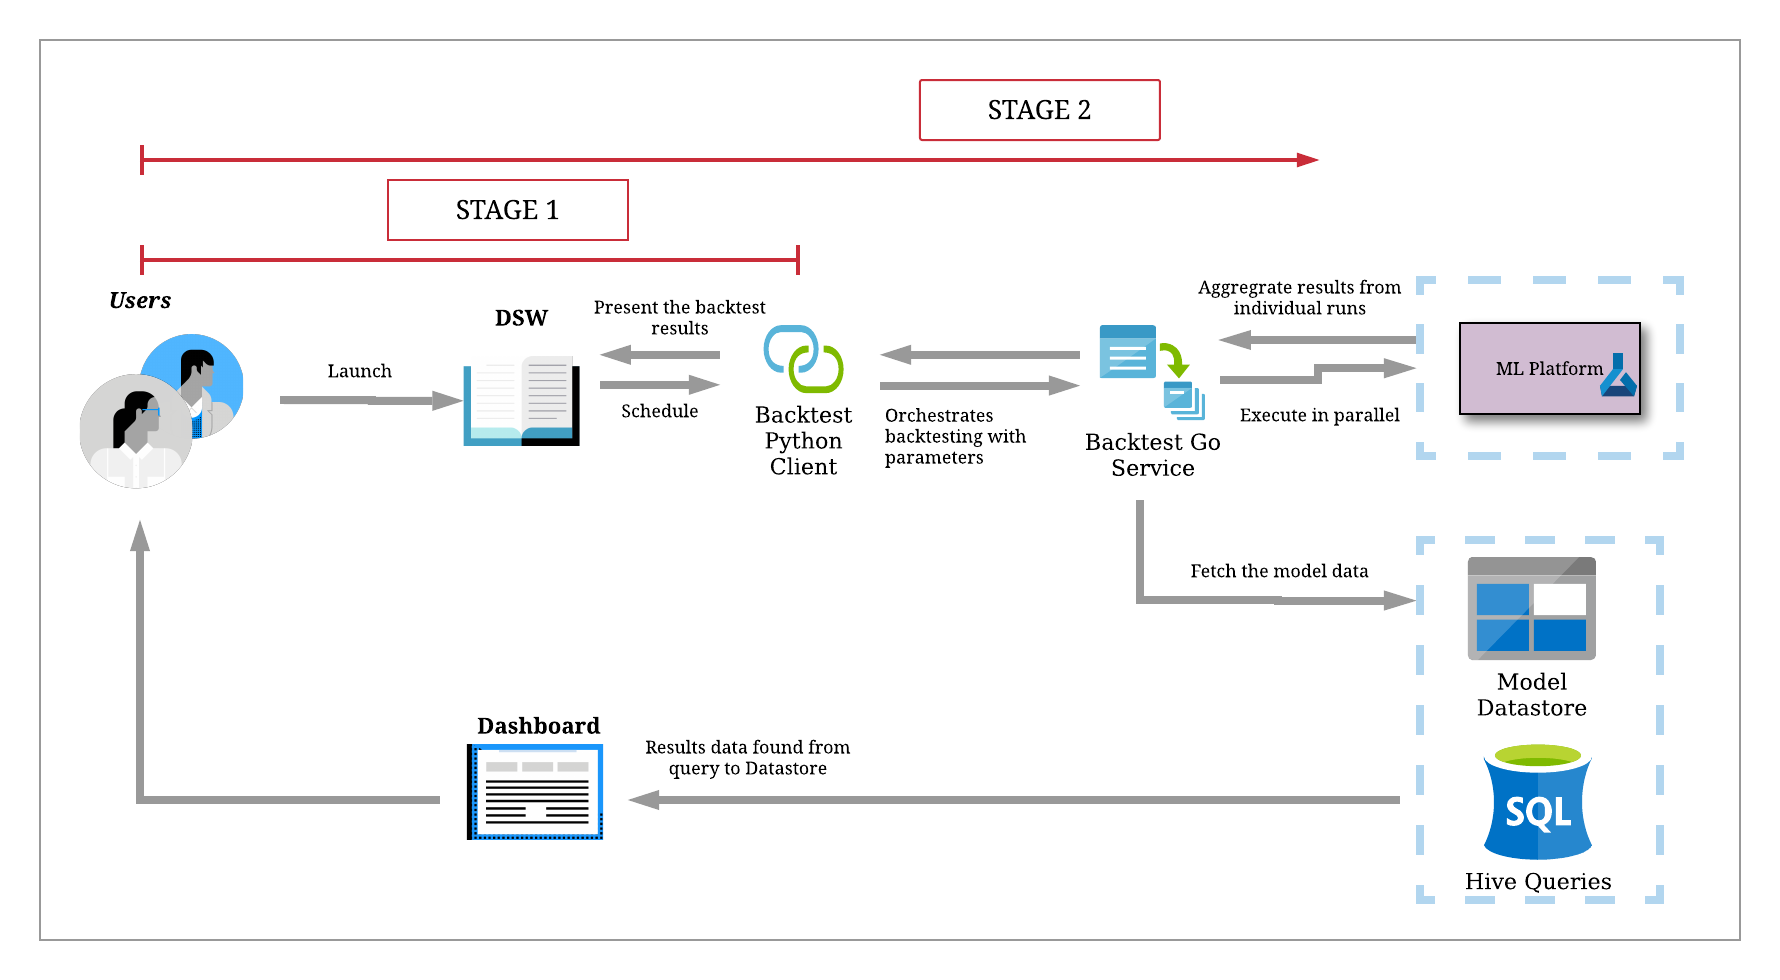
Imagine a data scientist wants to develop a model that predicts the number of Uber rides a given region in the first quarter of the year based on how many promotions are given out at the same time.
We can separate their activity into two stages: model development, where they iterate frequently within our lightweight Python client, and online model performance testing, where we ramp up backtests for their production-ready models at scale.
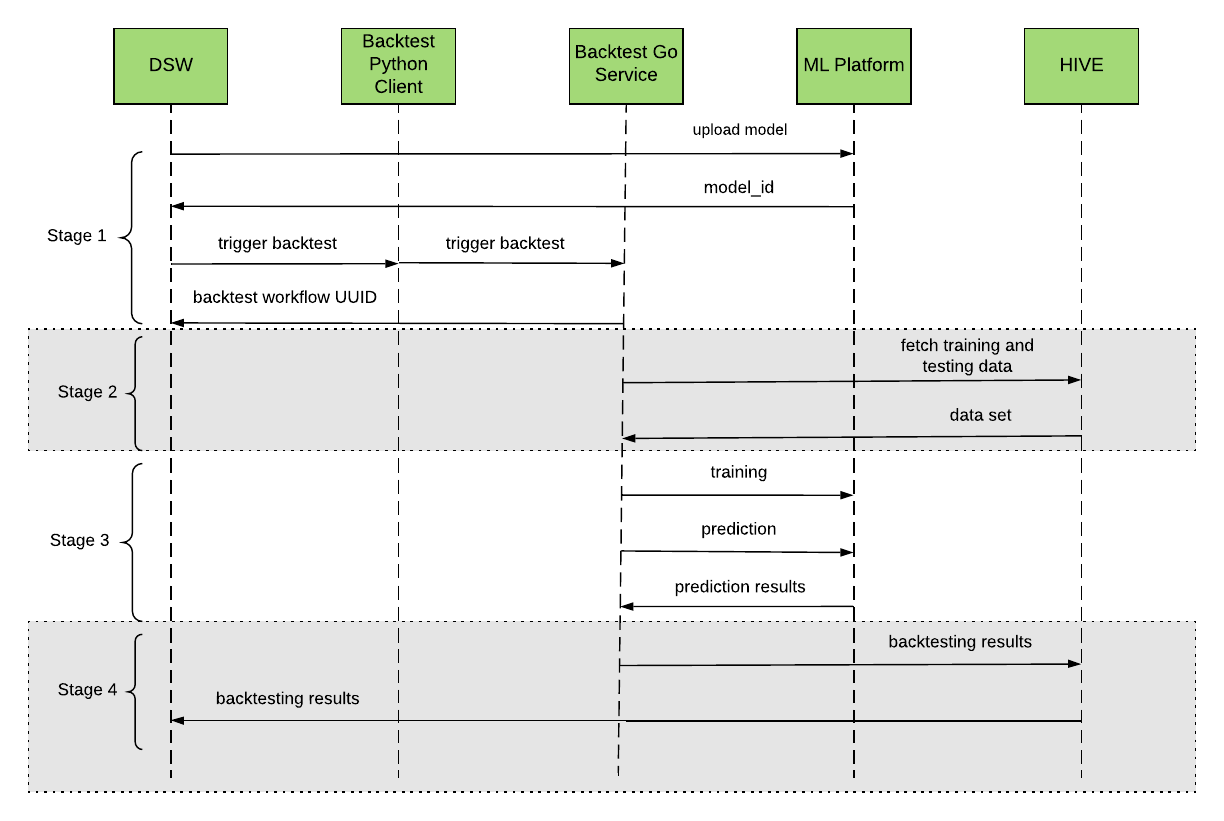
When we make a call to the backtesting service, the workflow process can be split into four different stages, as depicted in Figure 5, below:
Model development
During model development, we will want to run lots of experiments and iterate quickly on model designs from local machines. However, hitting our Go service incurs additional load and uses valuable computing resources that aren’t necessary for this purpose.
First, the user can either write the model locally in Data Science Workbench for testing or upload it into a machine learning platform, such as Michelangelo. If the latter, the ML platform will return a unique ID to the user. Then, the user can use this model ID to trigger our service to run backtesting through our Python client.
Initially, we will start backtesting on a small dataset. For example, we may only want to test our model against New York City, within the month of January, and for just one error type. This kind of backtest often takes less than a few minutes. Additionally, we do not need to deploy their model anywhere, as everything is self-contained in Data Science Workbench. They may even upload a CSV with data manually to their workbench or local session, as our Python client library offers a lightweight version of the same backtesting algorithm. This client encourages data scientists to experiment and consistently incorporate feedback to improve their models.
Model training and prediction
Once the user is finished with model development, they can deploy the model onto an ML platform, such as Uber’s Michelangelo, for training. Once the model is deployed, the next stage is users can ramp up their backtest runs to the production scale.
Once our Go service receives the request, it will validate the request and send back a unique workflow UUID to the user. The user can use this UUID to check the backtesting process and results. Then, the Go service will fetch the data set and split the data into multiple backtesting windows in parallel for different dimensions (such as cities, models parameters, …).
For each backtesting window, our Go service will send a training request to the machine learning platform. After training is finished, we will send a prediction request to get the prediction results for that backtesting window.
Once the backtesting service gets all prediction results, it will calculate the error and save the error results into the HIVE database. It will also send an email to the user to notify them the backtesting is done.
Model deployment
Once the model is in production, our data scientist can trigger massive backtesting workflows in our Go service, which is also accessible through the Python client. Our Go service can handle significantly larger loads, ultimately providing aggregate, holistic views of model performance. As previously mentioned, this feature of the backtesting services allows us to test our online model forecasting the quantity of Uber rides at a given point in the future against multiple windows along a sliding scale for multiple cities. We can even specify a larger training window size to prepare the model, such as two years.
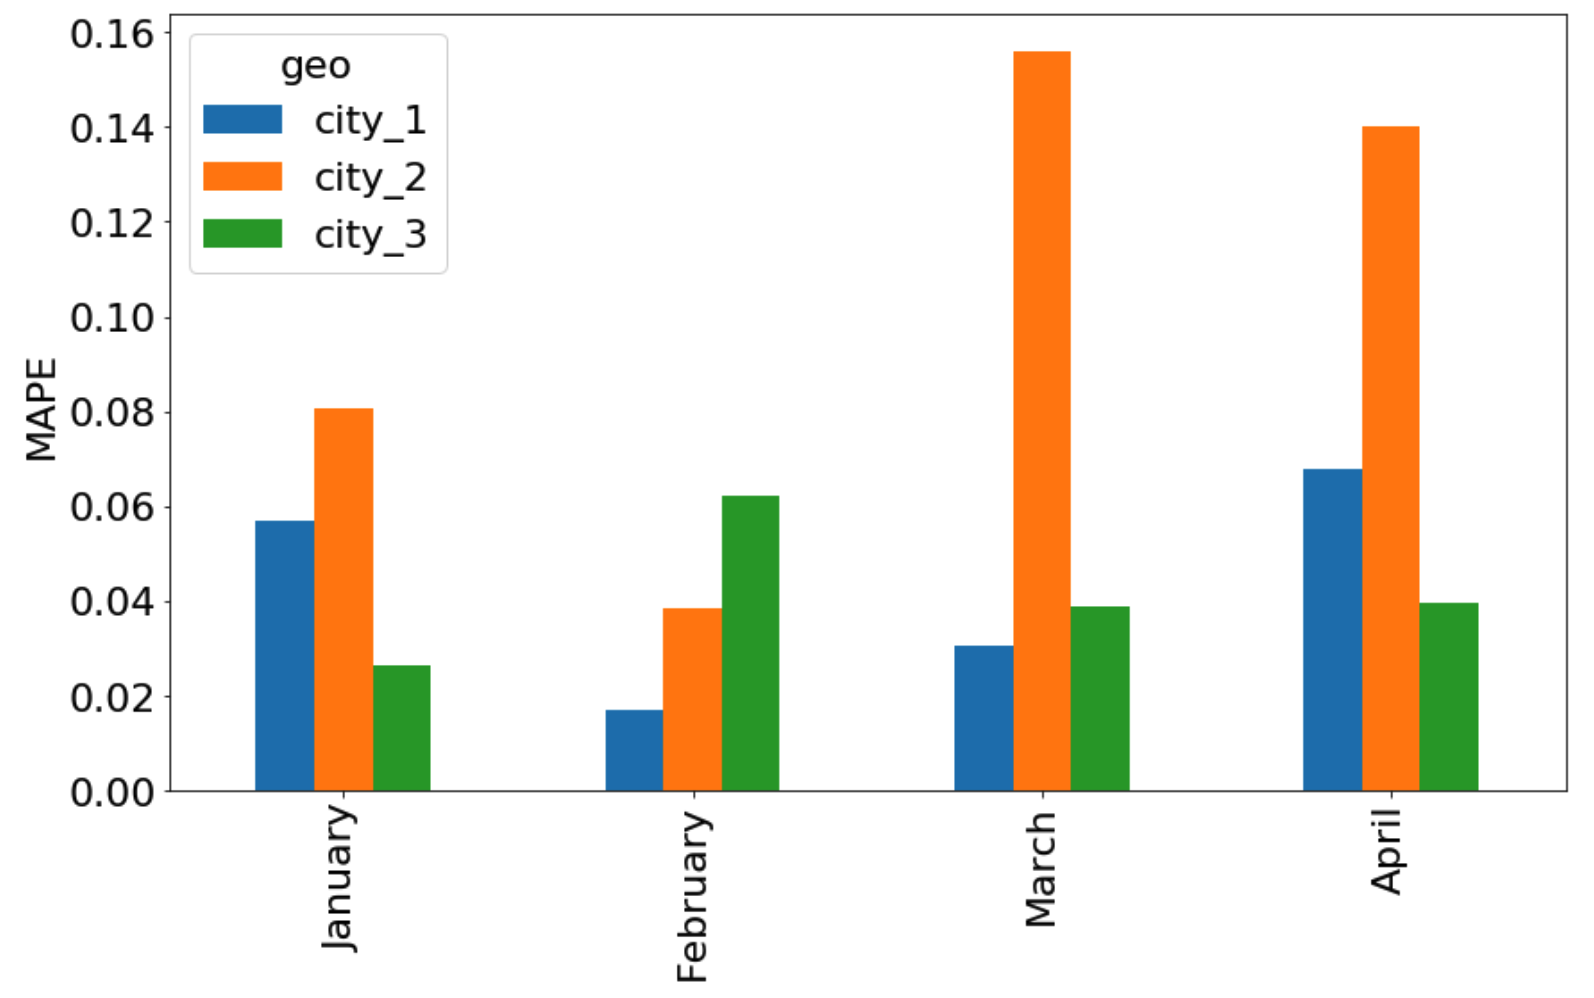
The backtesting job can run on a regular cadence—say each day, week, or month depending on our needs. Then, the data scientist can view and explore the backtesting results in a dashboard in Data Science Workbench or other tools through interactive graphs and plots, as depicted in Figure 6, below:
Driving forward
As of February 2020, we’ve onboarded six forecast models that are used regularly for financial planning and budget management this year. Our service supports more than ten error measurement types, and we’re working on developing tools and dashboards to visualize these error rates over time. Our users like knowing how their models are doing and data scientists benefit by gaining trust from this transparency. Beyond the decision of whether to use the models at all, our new backtesting service has the potential to surface more insights from our forecasts, and in turn, helps our operations teams improve the Uber experience for markets worldwide.
If working on ML-powered forecasting systems at scale interests you, consider applying for a role with Uber Engineering!

Sam Xiao
Sam Xiao is a senior software engineer on Uber’s Finance Intelligence team who leads the development and strategy behind backtesting services and other engineering initiatives to bring intelligent insights to financial forecasting and other areas.

Haoyu He
Haoyu He is a software engineer on Uber’s Finance Intelligence team who builds and operates our backtesting platform to run financial models and optimize our ML-based financial planning solutions.

Pooja Kodavanti
Pooja Kodavanti is a software engineer on Uber's Finance Intelligence team who works on the solutions that help us integrate forecast models into Uber’s financial planning tools.

Ethan Meng
Ethan Meng is a software engineer on Uber’s Finance Intelligence team who works on the backtesting service architecture and engineering excellence to improve the system performance.
Related articles


Most popular

Stopping Uber Fraudsters Through Risk Challenges
Scaling AI/ML Infrastructure at Uber

Information for driving during the week of Super Bowl LVIII

Uber Reveals 2023 “Airport of the Year” Award Winners
Products
Company
